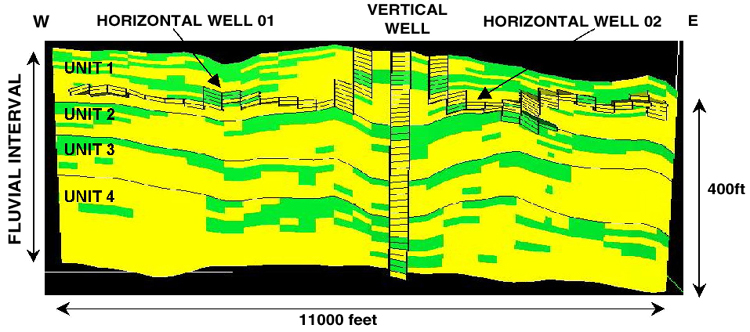
Figure 3. E-W Cross-section of a shale object-based simulation constrained by vertical and horizontal well data; green cells represent shales and yellow cells are sands.
Figure 3. E-W Cross-section of a shale object-based simulation constrained by vertical and horizontal well data; green cells represent shales and yellow cells are sands.