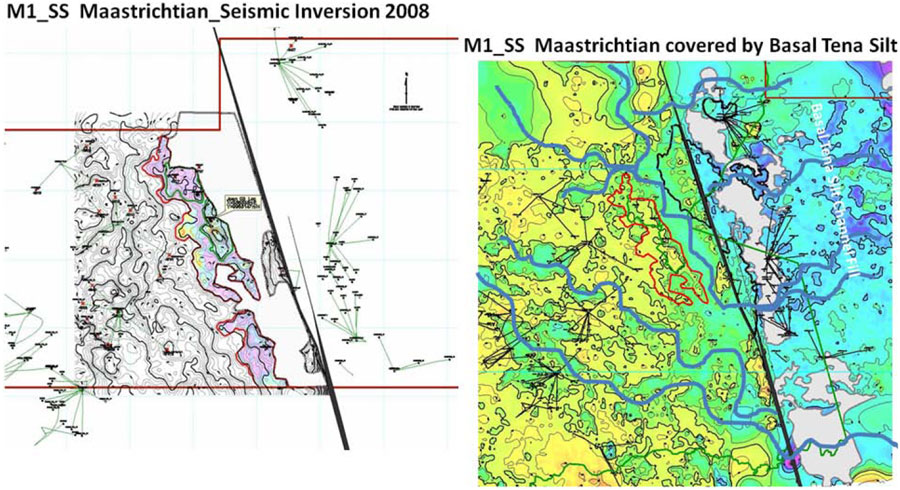
Figure 7. Left: seismic inversion results at 2008; Right: Careful isochrone map showing the previous P10 polygon, good correlation.
Figure 7. Left: seismic inversion results at 2008; Right: Careful isochrone map showing the previous P10 polygon, good correlation.