AAPG GEO 2010 Middle East
Geoscience Conference & Exhibition
Innovative Geoscience Solutions – Meeting Hydrocarbon Demand in Changing Times
March 7-10, 2010 – Manama, Bahrain
Reservoir Properties from Unbiased Seismic ![]() Inversion
Inversion![]()
(1) Reservoir Seismic Sewrvices, Schlumberger, Gatwick Airport, United Kingdom.
Low frequencies missing from seismic ![]() data
data![]() have to be modeled from log
have to be modeled from log ![]() data
data![]() for
for ![]() inversion
inversion![]() to absolute rock properties. This can result in biased
to absolute rock properties. This can result in biased ![]() inversion
inversion![]() results away from the existing wells. The risk of bias increases with higher frequency lowpass cutoffs of seismic
results away from the existing wells. The risk of bias increases with higher frequency lowpass cutoffs of seismic ![]() data
data![]() : more bandwidth added from the model (logs) and less from the seismic (measurement). Low frequencies and a broadband spectrum are also required to avoid errors in layer thickness after seismic
: more bandwidth added from the model (logs) and less from the seismic (measurement). Low frequencies and a broadband spectrum are also required to avoid errors in layer thickness after seismic ![]() inversion
inversion![]() and imaging.
and imaging.
Two-streamer and two-source over/under acquisition and processing technology enables effective source and receiver ghost eliminations that result in seismic ![]() data
data![]() rich in low frequencies down to about 3 Hz. This is about one octave gain over the conventional single streamer technology. As a result, over/under field
rich in low frequencies down to about 3 Hz. This is about one octave gain over the conventional single streamer technology. As a result, over/under field ![]() data
data![]() maps deep targets below basalt and a better structural imaging is obtained compared to conventional seismic
maps deep targets below basalt and a better structural imaging is obtained compared to conventional seismic ![]() data
data![]() .
.
Wedge ![]() modeling
modeling![]() and porosity and fluid substitution
and porosity and fluid substitution ![]() modeling
modeling![]() using extracted wavelets show that good
using extracted wavelets show that good ![]() inversion
inversion![]() results can be achieved with the over/under
results can be achieved with the over/under ![]() data
data![]() using only 3 Hz background models. Therefore possibility of bias due to low frequency component added from model
using only 3 Hz background models. Therefore possibility of bias due to low frequency component added from model ![]() data
data![]() during seismic
during seismic ![]() inversion
inversion![]() is either limited or eliminated.
is either limited or eliminated.
Introduction
Rock and reservoir parameters computed from inverted rock properties can be inaccurate, leading to wrong drilling and development decisions due to lack of low frequency information from conventional seismic ![]() data
data![]() . The missing low frequencies added from the models created using well log
. The missing low frequencies added from the models created using well log ![]() data
data![]() during
during ![]() inversion
inversion![]() may cause bias away from the existing wells. This may happen when the lithologies encountered at the wells thin or thicken away. In fact, some lens-like possible plays between the wells are often difficult or impossible to model accurately. The bias diminishes with increasing seismic bandwidth at low frequencies.
may cause bias away from the existing wells. This may happen when the lithologies encountered at the wells thin or thicken away. In fact, some lens-like possible plays between the wells are often difficult or impossible to model accurately. The bias diminishes with increasing seismic bandwidth at low frequencies.
Current seismic acquisition technologies can record low as well as high frequencies (Mougenot 2006). Land vibroseis acquisition currently provides ![]() data
data![]() with frequencies as low as 5 Hz, and even lower frequencies are potentially obtainable with modern vibrators and emerging sweep designs (Bagaini 2007).
with frequencies as low as 5 Hz, and even lower frequencies are potentially obtainable with modern vibrators and emerging sweep designs (Bagaini 2007).
In offshore applications, deeper source/receiver arrays improve imaging beneath screening reflectors such as salt domes and basalt layers. However, source and receiver ghosts deteriorate the seismic signature when they are deployed deeper for low frequency generation. Ghost removal during processing is a major issue. Success in removing ghosts has been limited, mostly because of variation in the source and receiver positions during acquisition.
An over/under survey deploying two sources and towing two streamers at different depths offers a good compromise enabling seismic ![]() data
data![]() to be obtained with a broader spectrum, especially at low frequencies. This is achieved by combining four datasets from over/under acquisition during processing (Davies et al. 2006; Davies and Hampson 2007; Hill et al. 2006 and 2007; Moldoveanu et al. 2007). This process effectively removes source and receiver ghosts and extends the low frequencies down to about 3 Hz on deeper sections without compromising high frequencies.
to be obtained with a broader spectrum, especially at low frequencies. This is achieved by combining four datasets from over/under acquisition during processing (Davies et al. 2006; Davies and Hampson 2007; Hill et al. 2006 and 2007; Moldoveanu et al. 2007). This process effectively removes source and receiver ghosts and extends the low frequencies down to about 3 Hz on deeper sections without compromising high frequencies.
Absolute rock properties inverted from seismic ![]() data
data![]() and the reservoir properties computed from them can be misleading due to missing low frequency information on conventional seismic
and the reservoir properties computed from them can be misleading due to missing low frequency information on conventional seismic ![]() data
data![]() (Ashley 1997; Whitcombe and Hodgson 2007; Özdemir et al. 2007; Özdemir 2008). See also Sengupta and Bachrach (2007) for uncertainties in volume estimation after seismic
(Ashley 1997; Whitcombe and Hodgson 2007; Özdemir et al. 2007; Özdemir 2008). See also Sengupta and Bachrach (2007) for uncertainties in volume estimation after seismic ![]() inversion
inversion![]() . Here the wedge models and the porosity and fluid substitution models are inverted to acoustic impedance (AI) to illustrate the importance of recorded low frequencies. The model
. Here the wedge models and the porosity and fluid substitution models are inverted to acoustic impedance (AI) to illustrate the importance of recorded low frequencies. The model ![]() data
data![]() are created using wavelets extracted from conventional and over/under
are created using wavelets extracted from conventional and over/under ![]() data
data![]() .
.
![]() Inversion
Inversion![]() of Field Over/Under
of Field Over/Under ![]() Data
Data![]()
The over/under survey was acquired utilizing two vertically aligned streamers at depths of 20 m and 30 m and two vertically aligned source arrays at depths of 12.5 m and 20 m. The depths were chosen with a view to optimizing the bandwidth below 70 Hz, and in particular, increasing the contributions of the very low frequencies by eliminating the first cable/source ghosts.
The notches in the amplitude spectra due to source and receiver ghosts were removed by combination of the four datasets (Davies et al. 2006). Figure 1 shows how well the reflections below basalt layers and deep structures are mapped on the over/under seismic section compared to the conventional section. Here the 12.5 m source and 20 m streamer ![]() data
data![]() is taken as the conventional
is taken as the conventional ![]() data
data![]() .
.
These ![]() data
data![]() sets were inverted to AI using background models from a projected vertical well (Well-A). The projected well AI has a simple trend below about 4500 ms (below basalt layers). In fact, the background model is not suitable either for the below basalt layers at lower CDPs or for the structure at the higher CDPs. A wideband seismic
sets were inverted to AI using background models from a projected vertical well (Well-A). The projected well AI has a simple trend below about 4500 ms (below basalt layers). In fact, the background model is not suitable either for the below basalt layers at lower CDPs or for the structure at the higher CDPs. A wideband seismic ![]() data
data![]() is particularly important for an unbiased
is particularly important for an unbiased ![]() inversion
inversion![]() in this case.
in this case.
Figure 2 shows the inverted AI difference between the over/under and the conventional ![]() data
data![]() using a 2/3 Hz lowpass AI background model from Well-A. Besides the expected jitter at the strong reflectors at basalt layers, the main difference is at the layers below basalt as expected from the seismic
using a 2/3 Hz lowpass AI background model from Well-A. Besides the expected jitter at the strong reflectors at basalt layers, the main difference is at the layers below basalt as expected from the seismic ![]() data
data![]() in Figure 1. The result from
in Figure 1. The result from ![]() inversion
inversion![]() with full background model is very similar to the one shown here. This is because the conventional
with full background model is very similar to the one shown here. This is because the conventional ![]() data
data![]() simply does not have the low frequency energy below basalt layers.
simply does not have the low frequency energy below basalt layers.
Although there is limited well control, the conclusions drawn were similar to those reached based on the synthetic results discussed next. Good ![]() inversion
inversion![]() results can be obtained from the over/under
results can be obtained from the over/under ![]() data
data![]() using only up to about 3 Hz background models.
using only up to about 3 Hz background models.
Wedge ![]() Modeling
Modeling![]()
We demonstrated the impact of low frequencies on amplitude ![]() inversion
inversion![]() with wedge models generated using wavelets extracted from the conventional and the over/under
with wedge models generated using wavelets extracted from the conventional and the over/under ![]() data
data![]() (Özdemir et al. 2007). The modeled synthetics included basalt layers and reservoir zones. Differences between the initial full bandwidth model and the
(Özdemir et al. 2007). The modeled synthetics included basalt layers and reservoir zones. Differences between the initial full bandwidth model and the ![]() inversion
inversion![]() results show that the missing low frequencies can lead to false interpretation of reservoir properties and/or hydrocarbon indicators. Good AI
results show that the missing low frequencies can lead to false interpretation of reservoir properties and/or hydrocarbon indicators. Good AI ![]() inversion
inversion![]() results are obtained from the over/under synthetic seismic with a background model containing only frequencies up to 3 Hz. The synthetic seismic sections were generated using zero phase wavelets statistically extracted from seismic
results are obtained from the over/under synthetic seismic with a background model containing only frequencies up to 3 Hz. The synthetic seismic sections were generated using zero phase wavelets statistically extracted from seismic ![]() data
data![]() . That is the wavelet spectra is a good representation of the corresponding conventional and over/under seismic
. That is the wavelet spectra is a good representation of the corresponding conventional and over/under seismic ![]() data
data![]() frequency content.
frequency content.
Figure 3 shows the AI ![]() inversion
inversion![]() results at an offshore well (Well-B, CDP-5). The top of the reservoir is at 1602 ms. Pay zone (oil) is 18 m (15 ms) thick. The conventional and the over/under AI errors are about 20% and 3% at the thin end of the wedge around the key well position, respectively. As indicated by the inserted water saturation (Sw) curves, the
results at an offshore well (Well-B, CDP-5). The top of the reservoir is at 1602 ms. Pay zone (oil) is 18 m (15 ms) thick. The conventional and the over/under AI errors are about 20% and 3% at the thin end of the wedge around the key well position, respectively. As indicated by the inserted water saturation (Sw) curves, the ![]() inversion
inversion![]() results are also poor on the conventional section at the possible but poor deeper reservoir zones with relatively high Sw (1650-1660 ms at CDP-5).
results are also poor on the conventional section at the possible but poor deeper reservoir zones with relatively high Sw (1650-1660 ms at CDP-5).
The spectra of the extracted wavelets with the spectra of the selected AIs from the wedge model at lower frequencies are shown in Figure 4. The over/under ![]() data
data![]() has about one octave improvement over the conventional
has about one octave improvement over the conventional ![]() data
data![]() . These recorded frequencies limit the contribution from model
. These recorded frequencies limit the contribution from model ![]() data
data![]() resulting in unbiased
resulting in unbiased ![]() inversion
inversion![]() results.
results.
Porosity and Water Saturation ![]() Modeling
Modeling![]()
A main purpose of doing seismic ![]() inversion
inversion![]() is often to map rock property and reservoir property variations away from the existing wells. We have modelled porosity and water saturation changes at the same well used for the wedge
is often to map rock property and reservoir property variations away from the existing wells. We have modelled porosity and water saturation changes at the same well used for the wedge ![]() modeling
modeling![]() above, using the conventional and over/under wavelets. The modelling of laterally changing porosity is particularly interesting because it incorporates both reservoir property change and thickness change, i.e., pinching out or wedging due to changes in seismic velocity.
above, using the conventional and over/under wavelets. The modelling of laterally changing porosity is particularly interesting because it incorporates both reservoir property change and thickness change, i.e., pinching out or wedging due to changes in seismic velocity.
Figure 5 shows the porosity ![]() modeling
modeling![]() and
and ![]() inversion
inversion![]() results. Porosity changes away from the key well position (CDP-11) over about 6% to 40 % range are well mapped on the over/under
results. Porosity changes away from the key well position (CDP-11) over about 6% to 40 % range are well mapped on the over/under ![]() inversion
inversion![]() while the conventional
while the conventional ![]() inversion
inversion![]() results are in error away from the vicinity of the key well. The porosity reduction creates a wedge effect away from the well position. This results in less than 10 ms thin reservoir layer that is not resolved/inverted accurately even on the over/under section. The actual model minus the inverted sections shows that the conventional
results are in error away from the vicinity of the key well. The porosity reduction creates a wedge effect away from the well position. This results in less than 10 ms thin reservoir layer that is not resolved/inverted accurately even on the over/under section. The actual model minus the inverted sections shows that the conventional ![]() data
data![]()
![]() inversion
inversion![]() result is inferior to the over/under result.
result is inferior to the over/under result.
The Sw ![]() modeling
modeling![]() (water replaces oil) results are shown in Figure 6. The AI change due to Sw is rather small and would hardly be traceable on noisy field
(water replaces oil) results are shown in Figure 6. The AI change due to Sw is rather small and would hardly be traceable on noisy field ![]() data
data![]() . The conventional AI
. The conventional AI ![]() inversion
inversion![]() result is very poor compared to the over/under section. As indicated by the difference sections, it is about 20-25 % in error while the over/under errors are about 5 % or less. The key well position here is at CDP-5 (Sw = 20 %).
result is very poor compared to the over/under section. As indicated by the difference sections, it is about 20-25 % in error while the over/under errors are about 5 % or less. The key well position here is at CDP-5 (Sw = 20 %).
The conventional ![]() inversion
inversion![]() results will be poorer in practice because seismic wavelets with ghosts cannot be accurately estimated. This will provide unsatisfactory results when subtle changes such as Sw variations are mapped.
results will be poorer in practice because seismic wavelets with ghosts cannot be accurately estimated. This will provide unsatisfactory results when subtle changes such as Sw variations are mapped.
It should be noted that unbiased ![]() inversion
inversion![]() cannot be guaranteed even with recorded frequencies down to 3 Hz. The low frequency seismic
cannot be guaranteed even with recorded frequencies down to 3 Hz. The low frequency seismic ![]() data
data![]() also enables the effective use of horizon-consistent seismic interval velocities for background
also enables the effective use of horizon-consistent seismic interval velocities for background ![]() modeling
modeling![]() . An efficient 3D offshore source and receiver deployment method is described by Kragh et al. (2009) to deliver such
. An efficient 3D offshore source and receiver deployment method is described by Kragh et al. (2009) to deliver such ![]() data
data![]() .
.
Conclusions
Over/under seismic ![]() data
data![]() has about one octave gain over conventional
has about one octave gain over conventional ![]() data
data![]() at low frequencies. Recorded low frequencies reduce/eliminate possible background model bias in seismic amplitude
at low frequencies. Recorded low frequencies reduce/eliminate possible background model bias in seismic amplitude ![]() inversion
inversion![]() . Thickness, porosity and water saturation
. Thickness, porosity and water saturation ![]() modeling
modeling![]() and
and ![]() inversion
inversion![]() using estimated wavelets shows that lateral reservoir properties can be mapped reliably using over/under seismic
using estimated wavelets shows that lateral reservoir properties can be mapped reliably using over/under seismic ![]() data
data![]() .
.
References
Ashley, F. 1997, Acoustic impedance ![]() inversion
inversion![]() pitfalls and some fuzzy analysis: The Leading Edge, 16, 275-280.
pitfalls and some fuzzy analysis: The Leading Edge, 16, 275-280.
Bagaini, C. 2007, Enhancing the Low-Frequency Content of Vibroseis ![]() Data
Data![]() with Maximum Displacement Sweeps: 69th EAGE Conference and Exhibition, London. Extended abstract B004.
with Maximum Displacement Sweeps: 69th EAGE Conference and Exhibition, London. Extended abstract B004.
Davies, K., Hampson, G., Reilly, A., and Swanston, A. 2006, Sub-basalt imaging using over under sources and receivers. Petr. Soc. Great Britton Mtg., PETEX’2006. Extended abstract.
Davies, K. and Hampson, G. 2007, UK Seismic Exploration Using Optimisation of Conventional and Over/Under Source, Cable Depths: 69th EAGE Conference and Exhibition, London. Extended abstract IO13.
Hill, D., Combee, L., and Bacon, J. 2006, Over/Under acquisition and ![]() data
data![]() processing: the next quantum leap in seismic technology? First Break, 24, 81-95.
processing: the next quantum leap in seismic technology? First Break, 24, 81-95.
Hill, D., Bacon, J., Brice, T., Combee, L., Koeninger, C., Leathard M. and McHugo, S. 2007, Over/Under a Technology for Illuminating Deep Objectives: 69th EAGE Conference and Exhibition, London. Extended abstract P186.
Kragh, E., Svendsen, M., Kapadia, D., Busanello, G., Goto, R., Morgan, G., Muyzert E. and Curtis, T. 2009, A Method for Efficient Broadband Marine Acquisition and Processing: 71st EAGE conference and Exhibition, Amsterdam. Extended Abstracts, V018
Moldoveanu, N., Combee, L., Egan, M., Hampson, G., Sydora, L. and Abriel, W. 2007, Over/Under towed-streamer acquisition: A method to extend seismic bandwidth to both higher and lower frequencies: The Leading Edge 26, 41-58.
Mougenot, D. 2006, Toward the low frequencies: land and marine equipment: First Break, 24, 37-41.
Özdemir, H., Leathard, M. and Sansom, J. 2007, Lost frequencies found-almost: ![]() inversion
inversion![]() of over/under
of over/under ![]() data
data![]() : 69th EAGE Conference and Exhibition, London. Extended abstract D028.
: 69th EAGE Conference and Exhibition, London. Extended abstract D028.
Özdemir, H. 2008, Unbiased deterministic seismic ![]() inversion
inversion![]() : 70th EAGE Conference and Exhibition, London. Extended abstract P353.
: 70th EAGE Conference and Exhibition, London. Extended abstract P353.
Sengupta, M. and Bachrach, R. 2007, Uncertainty in seismic-based pay volume estimation: Analysis using rock physics and Bayesian statistics: The Leading Edge 26,184-189.
Whitcombe, D. and Hodgson, L. 2007, Stabilizing the low frequencies: The Leading Edge 26, 66-72.
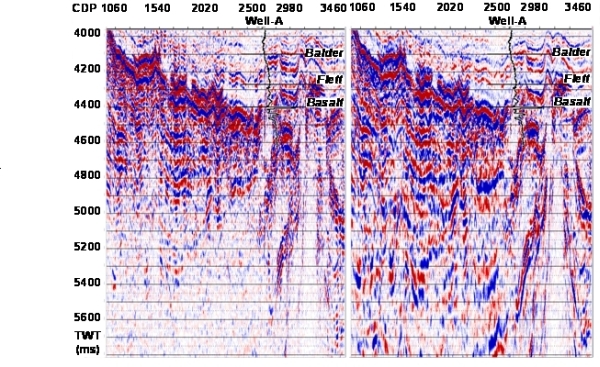 Figure 1. Conventional deep tow (left) and over/under (right) 2D seismic sections.
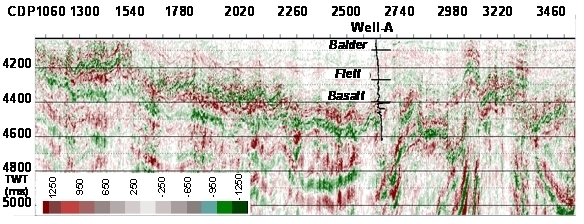 Figure 2. Difference of inverted AI sections (m/s*g/cm3): over/under minus conventional.
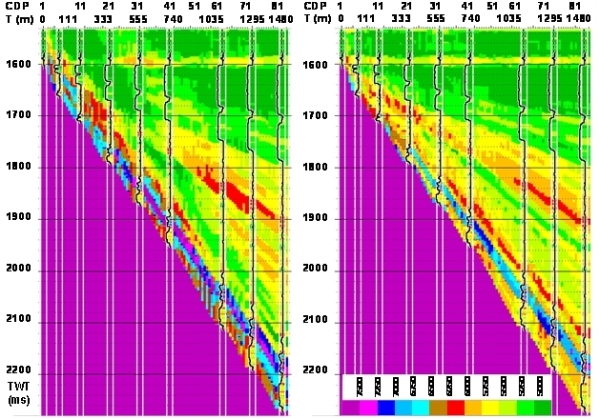 Figure 3. Inverted AI sections of wedge models. Conventional (left) and over/under (right). Reservoir zone is indicated by inserted Sw curves. T is the total thickness from top reservoir to TD. Key well is at CDP-5. A 3/4 Hz lowpass AI background model is used during
 ![]() inversion
inversion![]() . Color inserts are model well AI (m/s*g/cm3).
. Color inserts are model well AI (m/s*g/cm3).
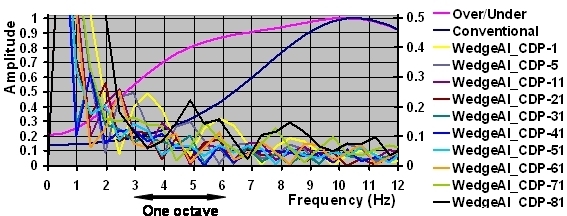 Figure 4. Frequency spectra of estimated wavelets and selected AIs of wedge model used in Figure 3. Log spectra axis is secondary axis. Wavelet spectra at higher frequencies almost overlap.
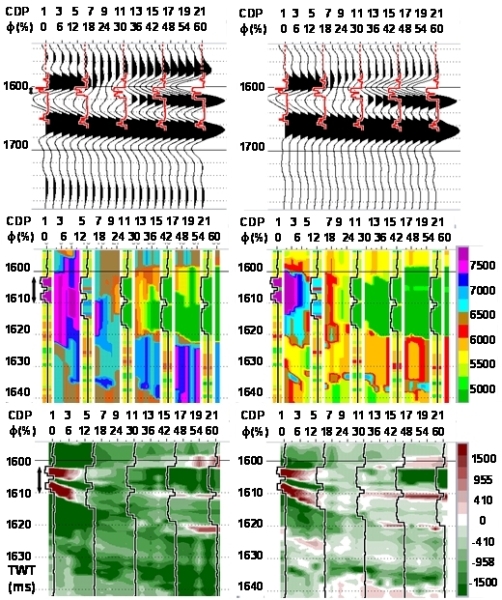 Figure 5. Porosity
 ![]() modeling
modeling![]() seismic sections (top), inverted AI sections using only a 3/4 Hz lowpass background model at key well (middle) and, actual model AI minus inverted AI difference sections (bottom). Conventional (left) and over/under (right). Sw curves inserted. Color inserts in the middle panel are model well AI (m/s*g/cm3).
seismic sections (top), inverted AI sections using only a 3/4 Hz lowpass background model at key well (middle) and, actual model AI minus inverted AI difference sections (bottom). Conventional (left) and over/under (right). Sw curves inserted. Color inserts in the middle panel are model well AI (m/s*g/cm3).
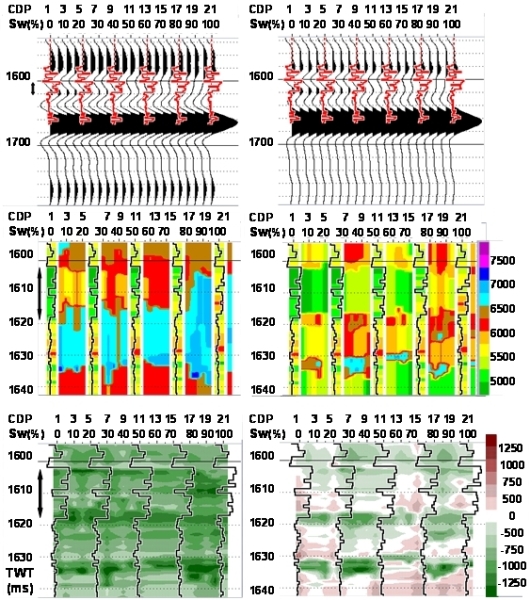 Figure 6. Water Saturation (Sw)
 ![]() modeling
modeling![]() seismic sections (top), inverted AI sections (middle) using only a 3/4 Hz lowpass background model at key well and, actual model AI minus inverted AI difference sections (bottom). Conventional (left) and over/under (right). Porosity curves inserted. Color inserts in the middle panel are model well AI (m/s*g/cm3).
seismic sections (top), inverted AI sections (middle) using only a 3/4 Hz lowpass background model at key well and, actual model AI minus inverted AI difference sections (bottom). Conventional (left) and over/under (right). Porosity curves inserted. Color inserts in the middle panel are model well AI (m/s*g/cm3).