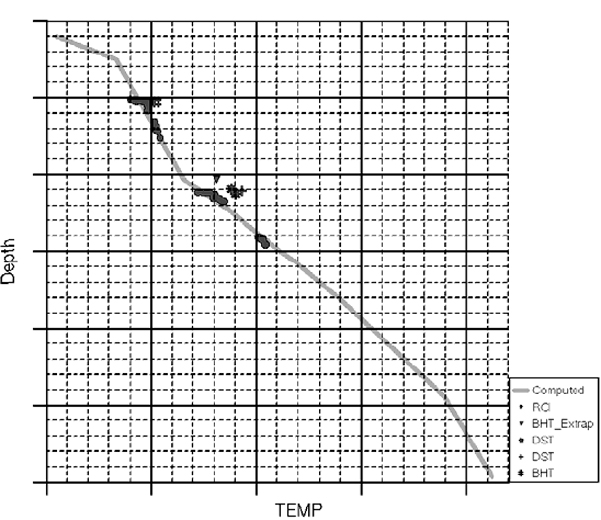
Figure 2. It is shown the temperature profile calculated with the heat flux time-series maps obtained with the optimization described above for the same well shown in Figure 1, where a better fit can be observed.
Figure 2. It is shown the temperature profile calculated with the heat flux time-series maps obtained with the optimization described above for the same well shown in Figure 1, where a better fit can be observed.