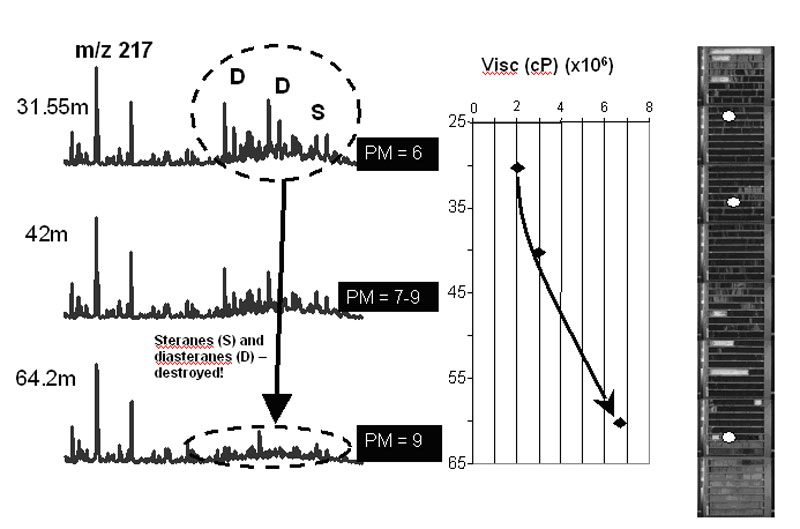
Figure 1. Physical and chemical methods show changes in bitumen quality and molecular composition downhole along the single petroleum column in AOSD. Left: disappearance of sterane and severe attack on diasterane compound indicates increased biodegradation from level 6 to level 9 on PM scale (Peters, K.E., Moldowan, J.M., 1993. The Biomarker Guide: Interpreting Molecular Fossils in Petroleum and Ancient Sediments, Prentice Hall, Englewood Cliffs, New Jersey, p. 363). Middle: Viscosity measurements shows that viscosity increased from 2 million cP at the top of the column to as low as 7 million cP at the base of the petroleum column. Right: the image of examined core (the length of each tube is 0.75 m.; bottom of each tube is on the right and the top on the left; black colour is due to bitumen stain on sand (bitumen saturated reservoir rock), and grey at the base and the top is mudstone that confines the reservoir. The white circles are sample points presented on the viscosity chart and m/z 217 mass fragmentograms; that track sterane compounds, on the left. In summary although bitumen looks the same in the core (solid phase) its physical properties and composition show that it is in fact very heterogeneous with the worst quality at the base of the continuous petroleum column.