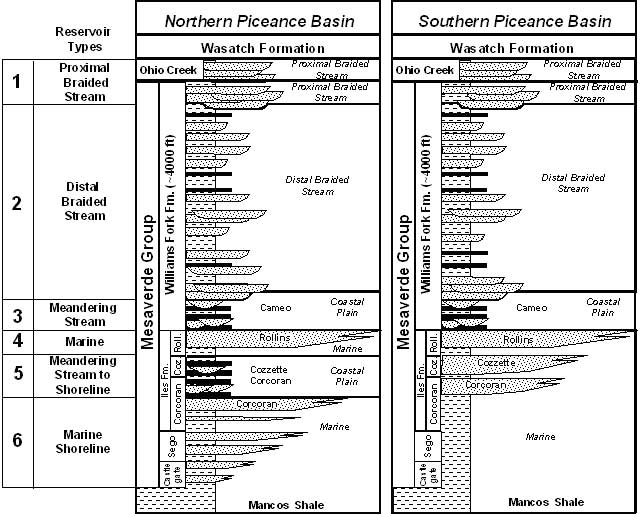
Figure 1. Stratigraphic chart for the northern and southern Piceance Basin showing the breakout of assessment intervals by lithofacies.
Figure 1. Stratigraphic chart for the northern and southern Piceance Basin showing the breakout of assessment intervals by lithofacies.