Seeing is Believing: A Quest to Visualize Hydraulic Frac Geometry for Optimal Resource Development
Abstract
Every frac guy will tell you that geometry matters! Whether it’s surface area, contact area, effective height, half-length or stimulated rock volume; more is typically better for enhancing productivity. However, many depictions of hydraulic fracture stimulations that appear in published do not adhere to simple physical rules (e.g. Rassenfoss, 2015) and commonly represent our ambition more than reality. So what is it that we actually create?
The most obvious technical solution would be to drill across the hydraulic fracs that are created and detect their locations and properties through logging or coring (e.g. Warpinski et al., 1993). Shell has two examples; LWD resistivity from the Haynesville and image logging from the Marcellus, which provide glimpses of the far-field geometry. However, examples of drilling across fracs are virtually non-existent in the published literature.
The universally preferred alternative is to collect data, conduct trials, and carry out modeling to characterize the frac geometry utilizing as many multi-disciplinary constraints as are available. To this end, two goals are being pursued; 1) characterize the sub-surface that matters the most for completions, and 2) create detailed stage-scale visualizations of geometry that adhere to physics.
For the first goal, novel rock templates (figure 1) have been created which show the variability in lithology, mechanical stratigraphy and horizontal stress anisotropy in each formation in Shell’s portfolio. By characterizing key sub-surface criteria that most impact geometry, it is easier to understand the constraints, which formations are appropriate completion-analogues and hence where different trials or technologies are likely to be more applicable.
For the second goal, visualizations of frac propagation in time have been created (figure 2), guided by microseismic, incorporating learnings from geomechanical theory and models and correlated with completion parameters from frac pump charts.
The key to understanding frac geometry is to embrace as many multi-disciplinary constraints as possible and overcome our heuristic biases, as debated by Stephenson et al. (2015). Only by generating as “real” visualizations as possible can we: a) characterize the controls of the sub-surface on geometry, b) understand the engineering influence on geometry, c) assess whether the design objectives of the specific hydraulic treatments are being met, and d) optimize the inter-related development decisions of well spacing and frac intensity. And while it is acknowledged that significant uncertainty remains, the hope is that seeing is believing.
References
Rassenfoss, S., 2015. What do fracture look like? A picture says a lot, even when it is wrong. Journal of Petroleum Geology, May 2015.
Stephenson, B., Cartwright, J., Hooker, J., Hnat, J., 2015. What Actually Controls SRV? Three Concepts to Debate a Stimulation or Stimulate a Debate! Unconventionals Resources Conference, Calgary, Oct 2015. SPE-175909-MS.
Warpinski, N. R., Lorenz, J. C., Branagan, P. T., Myal, F. R., & Gall, B. L. (1993, August 1). Examination of a Cored Hydraulic Fracture in a Deep Gas Well (includes associated papers 26302 and 26946 ). Society of Petroleum Engineers. doi:10.2118/22876-PA
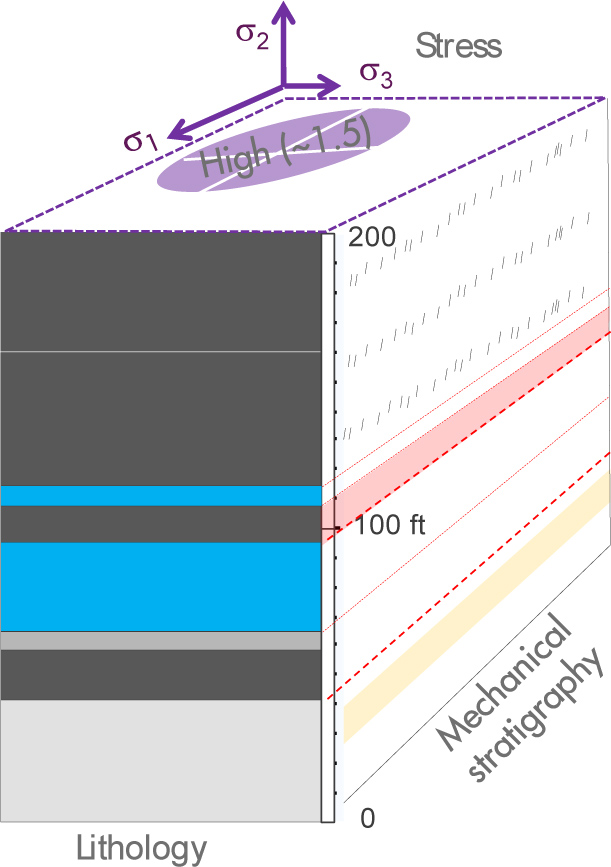
Figure 1: A "rock template" showing the lithology, mechanical stratigraphy and horizontal stress anisotropy.
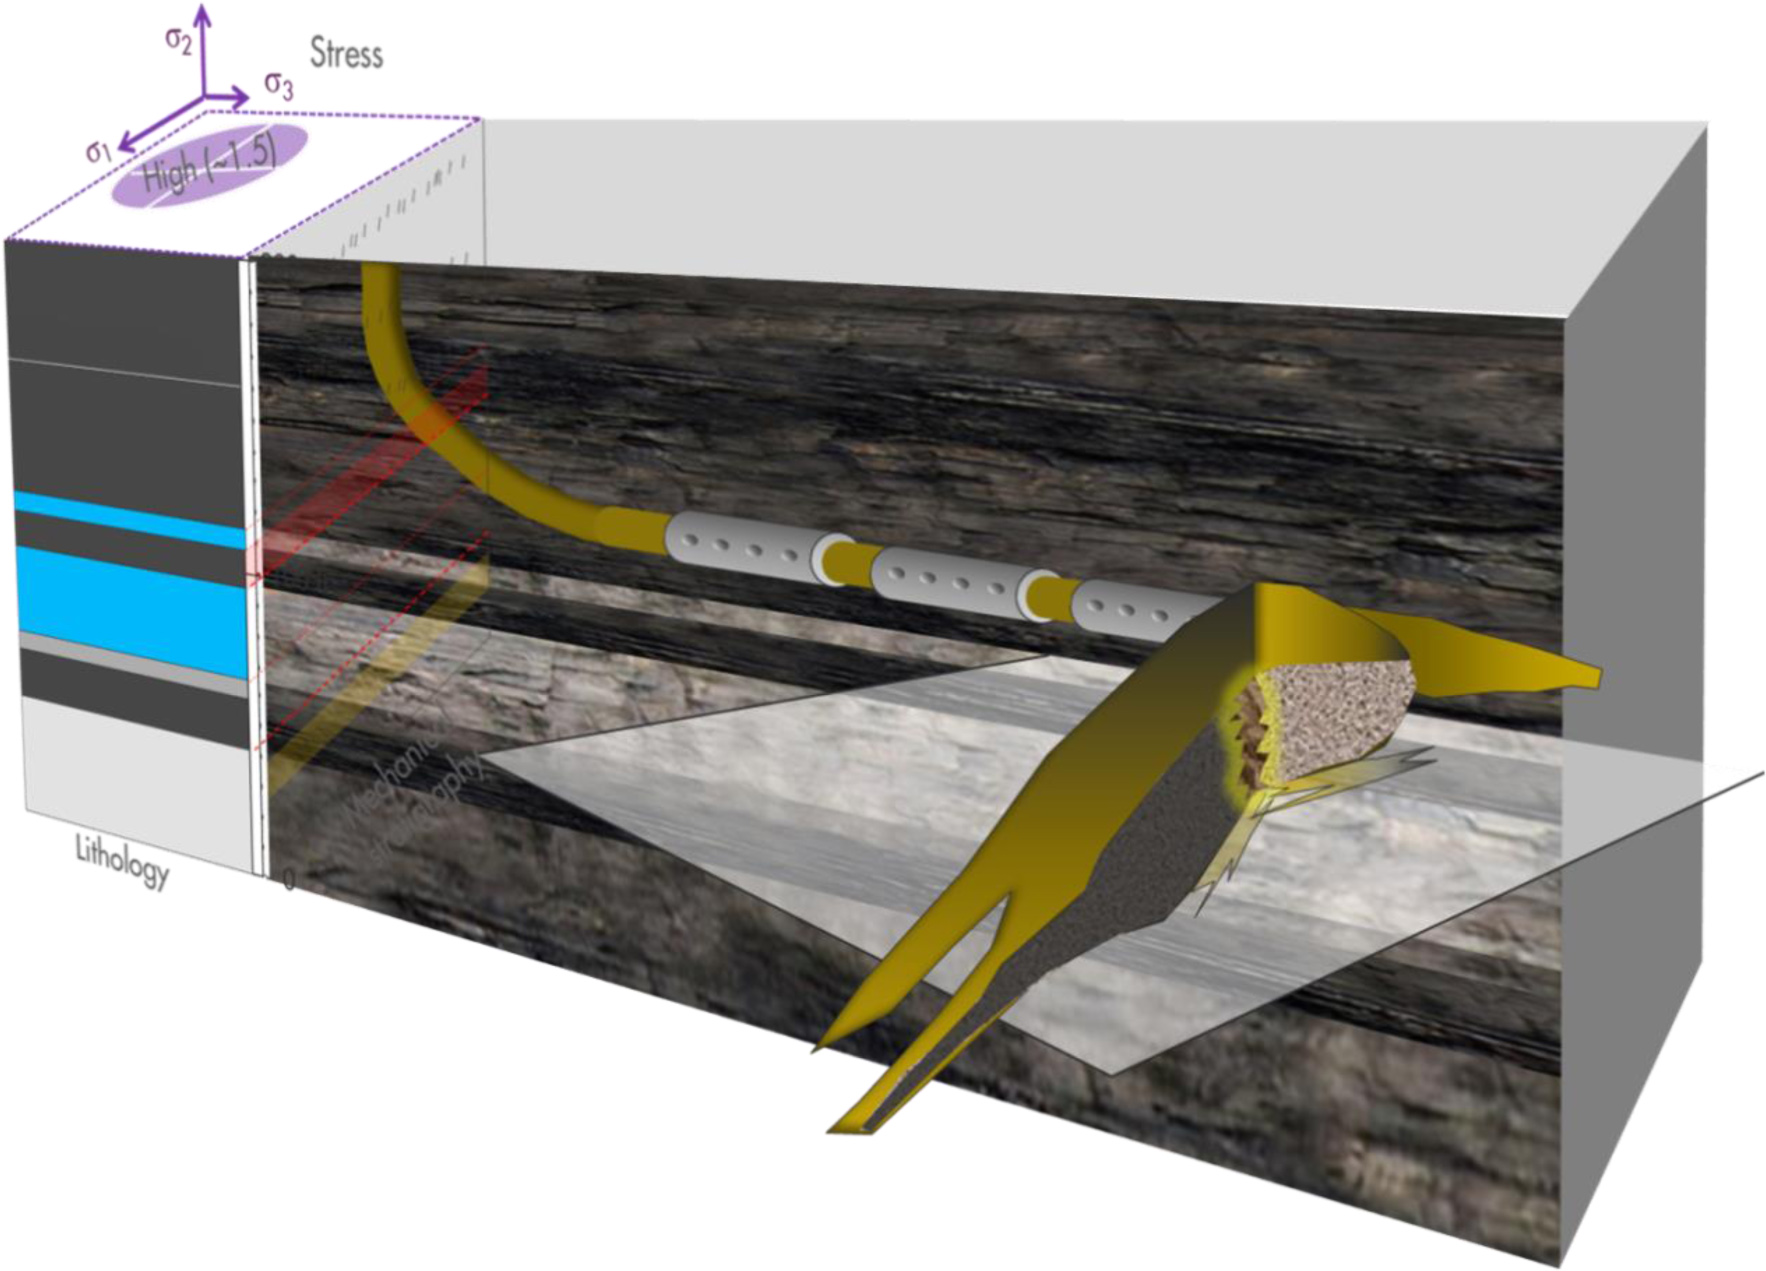
Figure 2: "Realistic" geometry of a single frac constrained by six data-supported, physical processes.
AAPG Datapages/Search and Discovery Article #90259 ©2016 AAPG Annual Convention and Exhibition, Calgary, Alberta, Canada, June 19-22, 2016