Interpreting a 3D World When Convention Relies Upon 2D Presentations
Peter Vrolijk, M. Ellen Meurer, and Sonia Bradley
ExxonMobil Upstream Research Company, Houston, TX
Abstract
Flow of gas, oil, and water in the subsurface follows complex 3D pathways. When reservoirs are developed in permeable sedimentary rocks and the subsequent reservoir framework disrupted by fault offsets, discovering the best, most permeable path between two points presents a formidable challenge. In effect, our goal is to define a geologic cross-section that lies along a streamline without any a priori knowledge of where that streamline runs. We are left trying to approximate the position of that streamline by attempting a regularly patterned interpretation of the geology.
The value of getting this problem 'right' in the petroleum industry is substantial. In the best case, a producing well is placed into a flow superhighway that drains an anomalously large volume of reservoir, resulting in a hugely profitable production well. In the worst case, a poorly positioned well draws a limited volume of fluid from the near wellbore region without connections and access to fluid volumes beyond. Pressures drop, production rates drop, and the well is abandoned with a financial loss.
The obstacles to getting this problem 'right' are numerous:
- The geometry of reservoir connections across faults is uncertain. Do the reservoir connections exist across a fault, and are they of sufficient quality to allow substantial fluid flux? Objectively answering this question requires an evaluation of the precision of the interpretation, especially with regard to the ability of any seismic data volume to produce a unique fault throw interpretation properly positioned in space, and the interpretation accuracy, which relies on the sensitivity of the connection interpretation to uncertainties in the stratigraphic definition at the fault and the fault throw/fault complexity interpretation.
- Given the interpretation uncertainty outlined in (1), there may be a multitude of pathways from A to B. Does one pathway dominate, or do multiple pathways contribute proportionately? Do multiple, redundant pathways overcome uncertainty in the interpretation? How do we identify the path with the shortest streamline when nature presents us with a multitude of potential pathways?
- How do we identify, evaluate, and compare multiple possible pathways when they cross from reservoir to reservoir across faults and across stratigraphic intervals? How do we use conventional map displays to account for flow from one stratigraphic reservoir interval to another across a fault? How do we use conventional cross-section displays when the trace of the appropriate cross-section is uncertain? How do we develop new, alternative displays that convey the essence of the complex 3D network to others, particularly those without strong spatial skills?
- How do we construct these geologic interpretations of connection networks efficiently, effectively, and accurately so that they can be evaluated with subsurface fluid pressure and composition data?
The answers to these questions require a comprehensive work process in a way that keeps the final questions (#4) in mind – how do we relate the geologic interpretation to subsurface fluid flow? The first issue (#1) is addressed by work processes that encourage meticulous, objective observations. Assuming that flow will be dominated by the best, most dependable flow pathways, the work processes require objective evaluations of all pathway connections across faults from which the best are culled.
The second issue acknowledges the fact that even with the benefit of extraordinary subsurface data, including continuous downhole pressure records, fluid tracer studies, and mass balance models, the means to test any single reservoir connection across a fault is difficult (impossible?) when multiple pathways are possible. Even in a mature producing asset, the subsurface is undersampled, and the means to conduct definitive scientific experiments are rare.
The third and fourth issues are related to different degrees depending on who is involved. An expert interpreter, someone adept at 3D thinking skills, is trying to get to the crux of the 3D problem as quickly as possible with the issues raised in #3 so they can test those ideas with subsurface fluid data (#4). Having made some measure of progress in this exercise, the expert is often obligated to return to #3 and explain the interpretation and reasoning to others, some with weak 3D skills.
ExxonMobil has pursued work processes that reduce the spatial order of these problems to enable the technical specialist to work more efficiently. Multi-fault analysis (James et al., 2004) collapses the 3D faulted trap problem into a 1D problem for the sake of analytical expediency, and it takes strong 3D skills to correctly translate problems and results between these two domains. More detailed questions about reservoir connectivity in faulted reservoirs are addressed by 2D depictions of faulted reservoirs defined in the Connectivity Diagrams (Fig. 1) of Reservoir Connectivity Analysis (Vrolijk et al., 2005). Both of these processes are necessary to help technical experts keep track of the complex book-keeping of faulted reservoir connections and to derive useful inferences.
However, the analytical products that the specialist finds useful for working through a problem are considered awful by those who seek to use the results of the analysis. Thus the specialist is compelled to devote time to describing the results with more conventional products like geologic maps and cross-sections and finds that neither of these display mediums properly expresses some of the nuances of the 3D problem. Rendering the solutions in 3D geologic models is also possible, but the effort required manipulating the model to express the essence and nuances of the 3D geologic interpretation often exceed the value of increased comprehension. It is almost as if the needs of the expert interpreter, who wants to work efficiently and relies upon strong 3D spatial skills, are antithetical to those who seek to use the results of the interpretation, even when the objectives of everyone involved are the same.
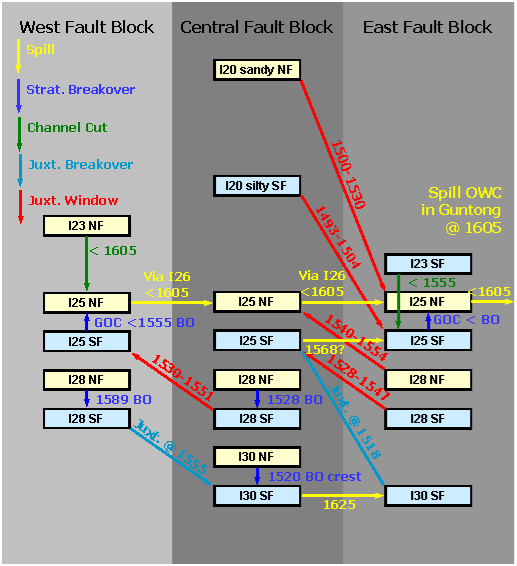
Figure 1. Connectivity Diagram of stacked reservoirs in a faulted trap. From Vrolijk et al. (2005).
References CitedJames, W. R., Fairchild, L. H., Nakayama, G. P., Hippler, S. J., and Vrolijk, P. J., Fault-seal analysis using a stochastic multifault approach, AAPG Bull, v. 88, p. 885-904.
Vrolijk, P., James, W., Myers, R., Maynard, J., Sumpter, L., Sweet, M., 2005, Reservoir Connectivity Analysis – Defining Reservoir Connections & Plumbing, MEOS 2005, SPE 93577.
AAPG Search and Discovery Article #120140© 2014 AAPG Hedberg Conference 3D Structural Geologic Interpretation: Earth, Mind and Machine, June 23-27, 2013, Reno, Nevada