Using Google Earth to Teach 3D Visualization of Structures, Interpretation of Geological Maps, and Cross Section Construction
Barbara J. Tewksbury
Hamilton College, Clinton, NY, USA
Abstract
Geologic map interpretation, cross section construction, and visualization of three dimensional geologic structures is difficult for students. For many years, I used a standard approach of defining strike and dip, units and types of contacts, teaching "rule of Vs" using diagrams and Play-Doh, and then working with geologic maps. Students with strong spatial abilities had no trouble with this approach, but many students memorized and applied rules and patterns rather than visualizing structures, with varying degrees of success. I now use Google Earth to help students visualize structures and make their own maps and cross sections before working with published maps.
The interactive 3D terrain viewing capability of Google Earth makes it a terrific resource for teaching visualization of structures. Using tilt, rotate, and zoom, students can see the third dimension directly. Google Earth satellite images in many places show strong, contrasting colors for bedrock units (below left, near Chahar Gas, Iran). The Google Earth 3D view helps students visualize that the color bands are actually layers that extend below ground. This is an enormous break-through over previous approaches that I've used, where many students see map units as 2D paint stripes.
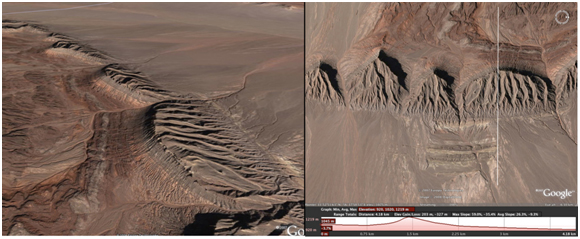
In this approach, students do their own geologic mapping in Google Earth before they know anything about strike, dip, or types of contacts. Being able to tilt and view from any direction allows students to make their own geologic maps successfully, despite having little or no experience. They can also see directly which way contacts are inclined. The tilt and fly-through views also help students successfully sketch topographic profiles and cross sections. The elevation profile tool (above right) in Google Earth allows students to create an accurate profile for their cross sections and adjust the profile to remove vertical exaggeration.
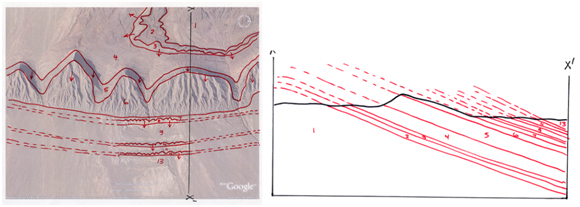
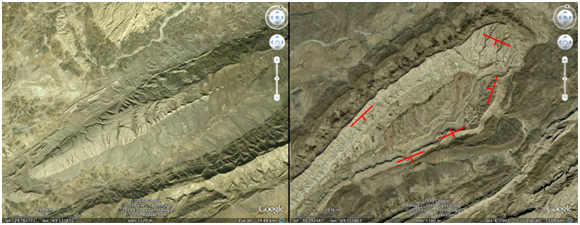
Whereas many instructors start with horizontal contacts because they seem simpler and don't require defining strike and dip, I start with inclined contacts because they are actually easier for students to "see" in Google Earth. Students can even estimate dip with a protractor by tilting the view and looking directly down a line of flatirons or hogbacks. Strike is a more difficult concept for students to grasp than is dip, and I use Google Earth to derive strike after students understand dip. In Google Earth, it is possible to use the path tool to "reconstruct" eroded contacts with strike lines (above right, near Dekhuyeh, Iran). Students then use the measure tool to and trig to calculate the dip, and a protractor to measure the strike.
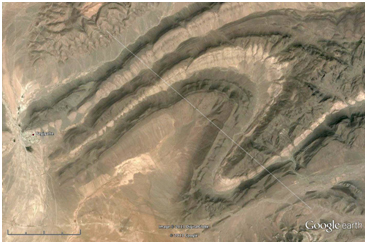
Because folds are simply special cases of dipping units, students work next with folds (e.g., right, near Tagigalte, Morocco), creating cross sections first and using Google Earth to visualize what plunge means, and then learning how to symbolize folds on a geologic map.
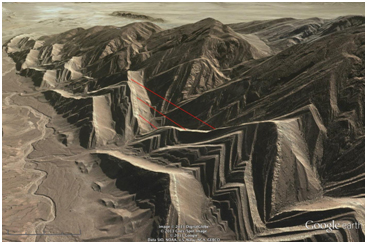
Students work next with vertical contacts, and the Google Earth 3D view is again instrumental in helping students visualize erosion of vertical contacts (below, near Spanish Peaks, Colorado). Tilting in Google Earth makes it clear that erosion of vertical contacts is simply a special case of erosion of dipping contacts.
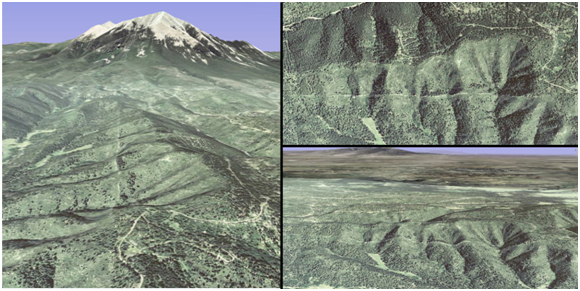
Once students have mastered vertical contacts, they can use Google Earth to compare the simple upright folds that they have been working with (e.g., below left near Nahar Kot, Pakistan) and overturned folds that are fabulously exposed in several of the fold and thrust belts around the world (e.g., below right near Bahlol, Pakistan).
AAPG Search and Discovery Article #120140© 2014 AAPG Hedberg Conference 3D Structural Geologic Interpretation: Earth, Mind and Machine, June 23-27, 2013, Reno, Nevada