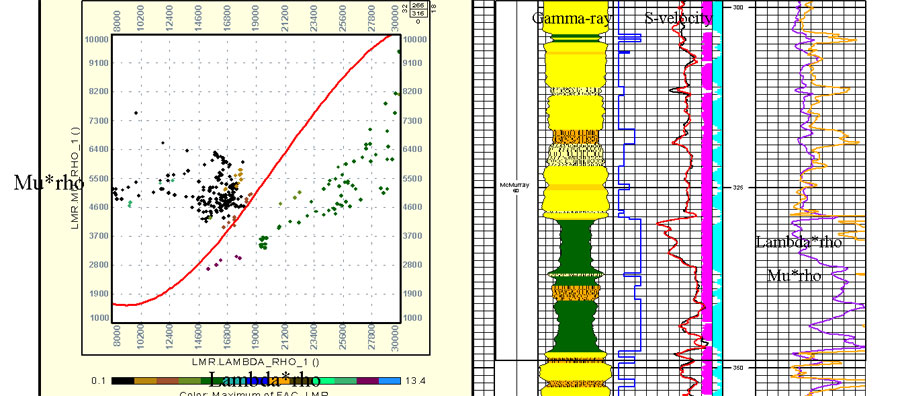
Figure 3: a) Crossplot showing lambda*rho, mu*rho points from well 5-13 colored by facies. Points above the curve are reservoir facies and points below are non-reservoir. b) Log display for well 5-13.
Figure 3: a) Crossplot showing lambda*rho, mu*rho points from well 5-13 colored by facies. Points above the curve are reservoir facies and points below are non-reservoir. b) Log display for well 5-13.