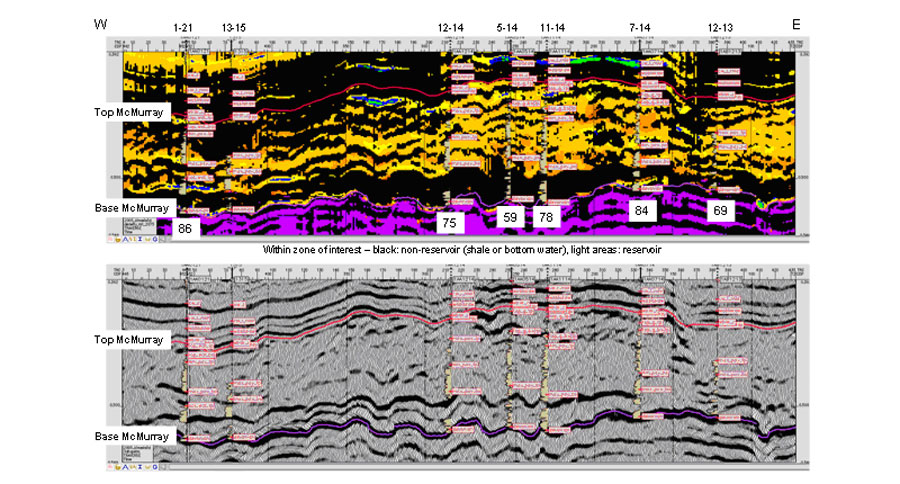
Figure 2: Comparison of conventional seismic profile (bottom) with derived facies profile (top). Black represents non-reservoir (shale or bottom water), light areas are bitumen reservoir. Gamma ray logs with 0 to 70 (at baseline) api range are displayed on the profiles. 13-15 was the only well on this profile used in the derivation of facies shown above, the rest were drilled after the facies volume was completed. The numbers shown below the well bores are the percentage match on a meter-by-meter basis of the predicted facies from seismic with the actual facies from logs within the zone of interest.