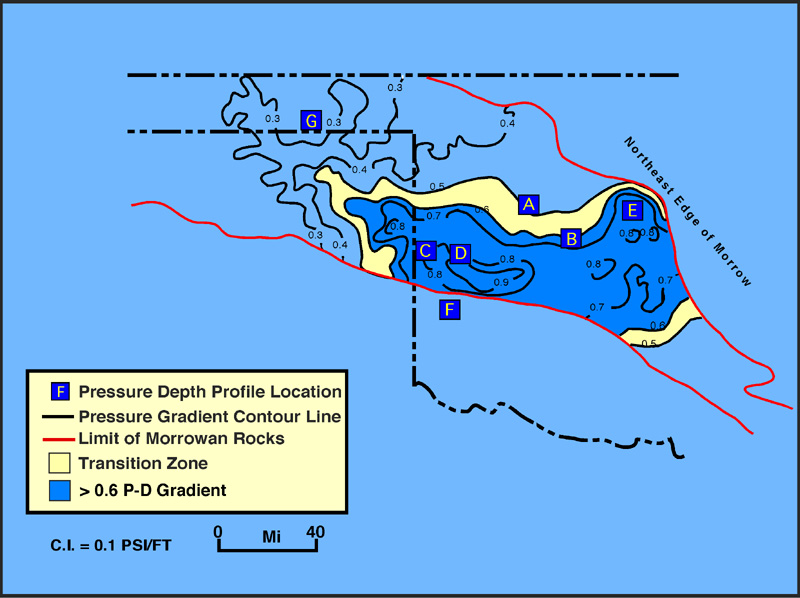
Figure 37. Pressure gradient map of Morrowan reservoirs in Anadarko basin, where the reservoirs are overpressured, and Oklahoma Panhandle, characterized by underpressured Figure 38. Pressure-depth plots for four different localities in Anadarko basin – Oklahoma Panhandle (locations shown in Figure 37). Overpressure is shown at point C; underpressure at point G; normal pressure at point A; slight underpressure in much of Pennsylvanian section at point F.