Combining Surface Geochemistry and Axial Surface Map Analysis for Petroleum Exploration
Julio Perez-Infante1, Enrique Novoa1, Irene Romero1, Marcias Gonzalez1, Claudia Fintina1, Carmen Zambrano1, Marco Odenhal2, and Angel Gonzalez2
Search and Discovery Article #40010 (2001)
(1) PDVSA-Intevep, Losteques, Miranda, Caracas, Venezuela
(2) PDVSA E&P
Adapted for online presentation from the authors’ poster presentation at AAPG Annual Meeting, New Orleans, Louisiana, April 16-19, 2000.
Editorial Note: This article, which is highly graphic (or visual) in design, is presented as: (1) three posters, with (a) each represented by a small, low-resolution image map of the original; each illustration or section of text on each poster is accessible for viewing at screen scale (higher resolution) by locating the cursor over the part of interest before clicking; and (b) each represented by a pdf image, which contains the usual enlargement capabilities; and (2) HTML text and abbreviated figure captions linked to corresponding illustrations with descriptions.
Users without high-speed internet access to this article may experience significant delay in downloading many of these illustrations due to their sizes.
First Poster –Purpose, Experimentation and Analysis, Geology
![]() Click here to view pdf version of the First Poster.
Click here to view pdf version of the First Poster.
Second Poster -Geochemistry
![]() Click here to view pdf version of the Second
Poster.
Click here to view pdf version of the Second
Poster.
Third Poster –Integration, Conclusions
![]() Click here to view pdf version of the Third
Poster.
Click here to view pdf version of the Third
Poster.
There is a number of geologic factors that affect the expression of gas anomalies on surface: depth and reservoir quality, seal integrity, presence of fractures or faults, as well as vegetation, climate, topography and hydrology. The understanding of all these elements and migration mechanisms of gases in the petroleum system play a key role to make an appropriate interpretation of surface geochemistry data.
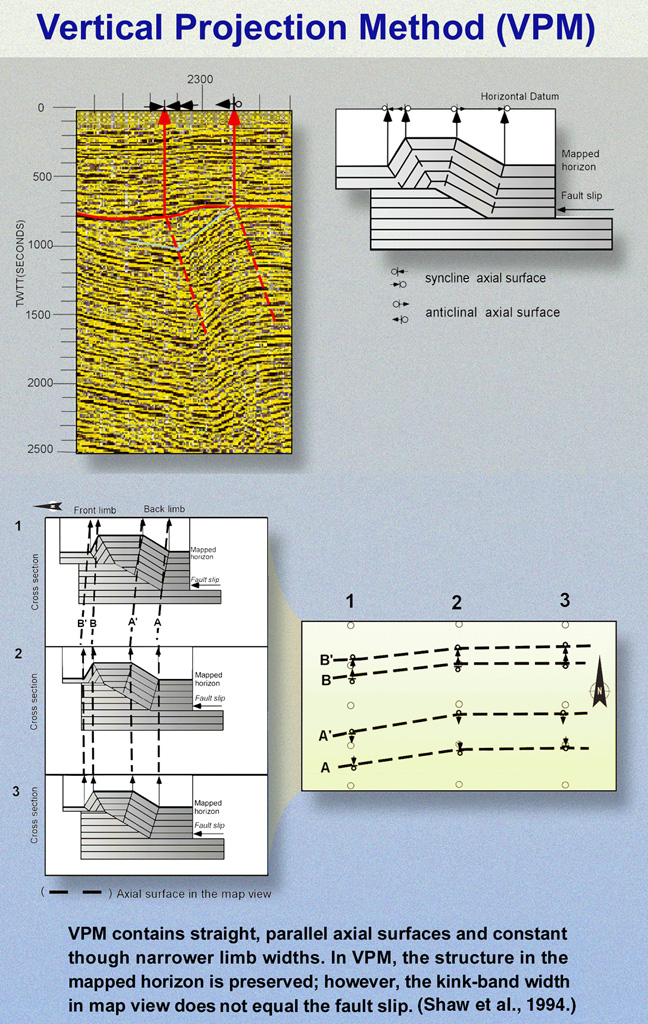
Axial surfaces represent the boundary between two adjacent dip panels within a given fold. Recently, methods have been developed to map this feature: the vertical projection and the parallel projection. Axial surface maps define fold trends, constrain underlying fault geometry and slip, and highlight and connect regions that can be interpreted by a series of balanced cross sections. In this work, we propose the integration of axial surface and geochemistry surface anomaly maps to identify leads in fold belts. Vertical projection is used because it preserves the horizontal position of the structure.
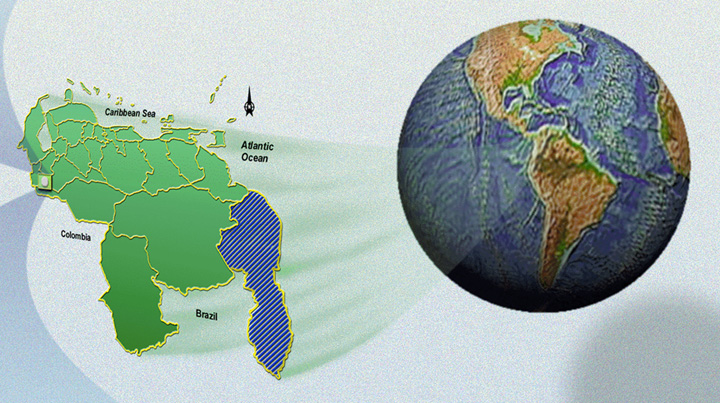
As an example of the application and integration of both techniques, we present the results of a study in a region of approximately 300 km2 located in western Venezuela. Most structural trends in the area have a NE-SW orientation. Two of these structural trends have large methane anomalies on top of them. The agreement between structure and methane anomalies in map view has allowed us to define two leads in the region. This result shows that the combination of both techniques is useful to guide exploration studies in fold belts.
Purpose, Experimentation and Analysis, and Geology
To improve the understanding of
petroleum systems in fold belts of western Venezuela, using axial surface map
analysis and geochemistry surface anomaly maps. This integration is also
supported by basin modeling using geochemical and stratigraphic source rock data
and structural analysis derived from seismic information.
-
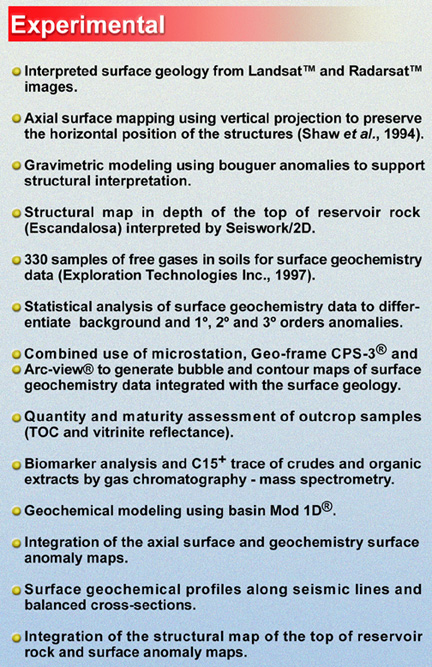
Interpreted surface geology from Landsat™ and Radarsat™ images.
-
Axial surface using vertical projection to preserve the horizontal position of the structures (Shaw et al., 1994).
-
Gravimetric modeling using bouguer anomalies to support structural interpretation.
-
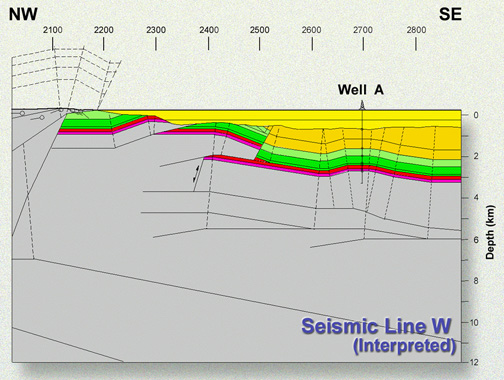
Structural map in depth of the top of reservoir rock (Escandalosa) interpreted by Seiswork/2D.
-
330 samples of free gases in soils for surface geochemistry data (Exploration Technologies Inc., 1997).
-
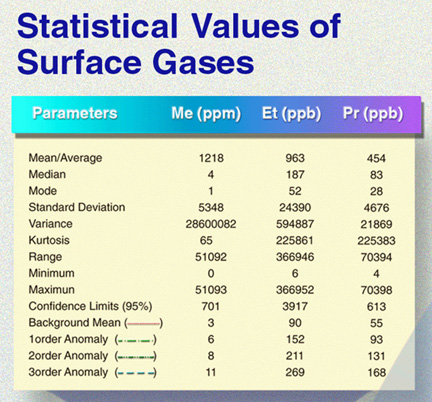
Statistical analysis of surface geochemistry data to differentiate background and 1o, 2o, and 3o orders anomalies.
-
Combined use of microstation, Geo-frame CPS-3© and Arc-view© to generate bubble and contour maps of surface geochemistry data integrated with the surface geology.
-
Quantity and maturity assessment of outcrop samples (TOC and vitrinite reflectance).
-
Biomarker analysis and C15+ trace of crudes and organic extracts by gas chromatography – mass spectrometry.
-
Geochemical modeling using basin Mod 1D©.
-
Integration of the axial surface and geochemistry surface anomaly maps.
-
Surface geochemical profiles along seismic lines and balanced cross-sections.
-
Integration of the structural map of the top of reservoir rock and surface anomaly maps.
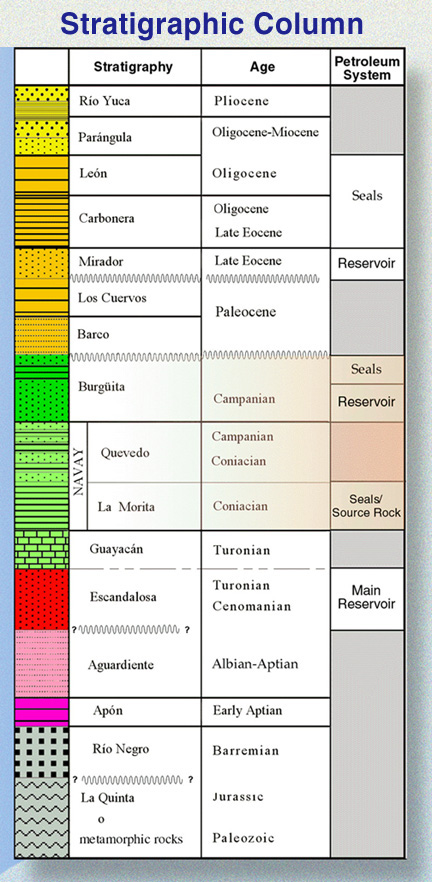
Geology
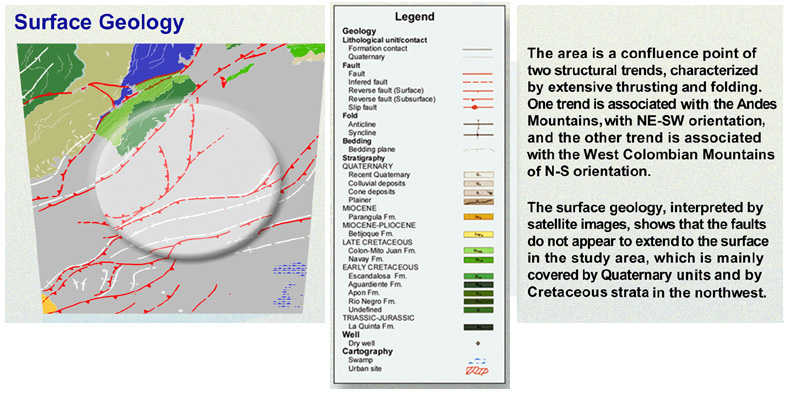
The area is a confluence point of two structural trends, characterized by extensive thrusting and folding. One trend is associated with the Andes Mountains, with NE-SW orientation, and the other trend is associated with the West Colombian Mountains of N-S orientation.
The surface geology, interpreted by satellite images, shows that the faults do not appear to extend to the surface in the study area, which is mainly covered by Quaternary units and by Cretaceous strata in the northwest.
Structural Map of the Reservoir Rock (top)
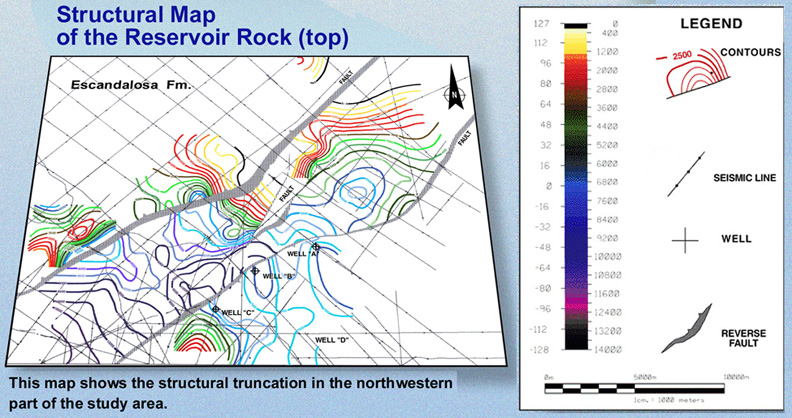
The map shows structural truncation of the Escandalosa Formation in the northwestern part of the area.
Vertical Projection Method (VPM)
VPM contains straight, parallel axial surfaces and constant though narrower limb widths. In VPM, the structure in the mapped horizon is preserved; however, the kink-band width in map view does not equal the fault slip. (Shaw et al., 1994.)
This map defines fold trends, constrains underlying fault geometry and slip, and highlights and connects regions that can be interpreted by a series of balanced cross-sections. Most structural trends in the study area have a NE-SW orientation.
Illustrations
Structural Map of the Reservoir Rock (top)
Vertical Projection Method (VPM)
Geochemistry
Subsurface
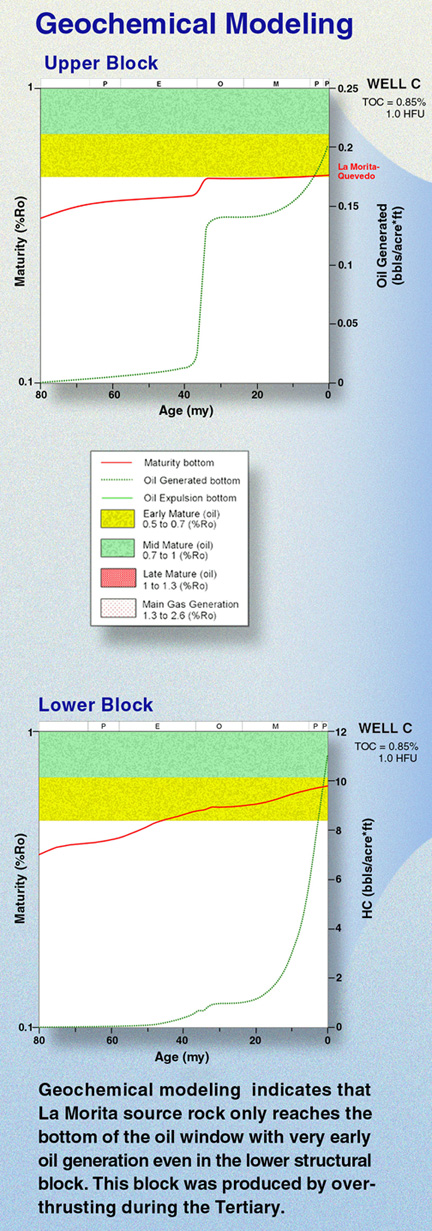
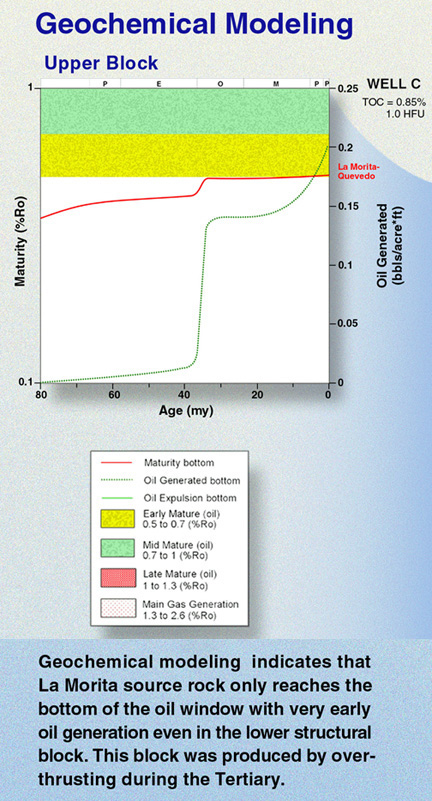
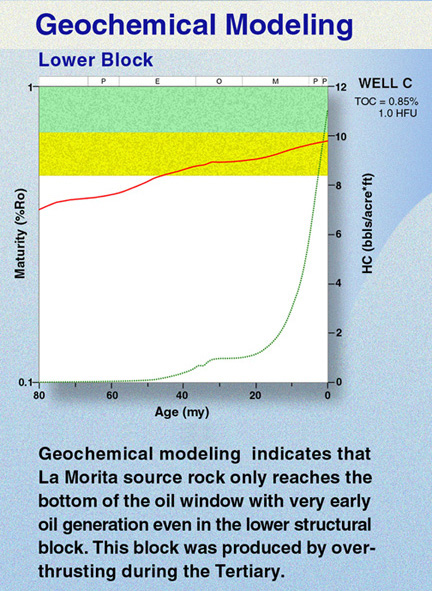
Geochemical modeling indicates that La Morita source rock only reaches the bottom of the oil window with very early oil generation even in the lower structural block. This block was produced by overthrusting during the Tertiary.
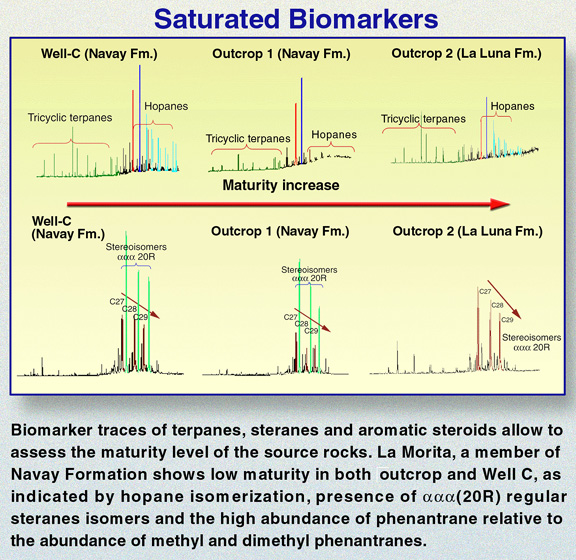
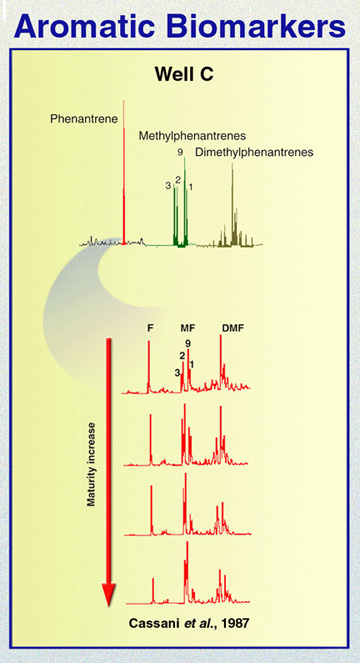
Biomarker traces of terpanes, steranes, and aromatic steroids allow to assess the maturity level of the source rocks. La Morita, a member of Navay Formation shows low maturity in both outcrop and Well C, as indicated by hopane isomerization, presence of aaa (20R) regular steranes isomers and the high abundance of phenantrane relative to the abundance of methyl and dimethyl phenantranes.
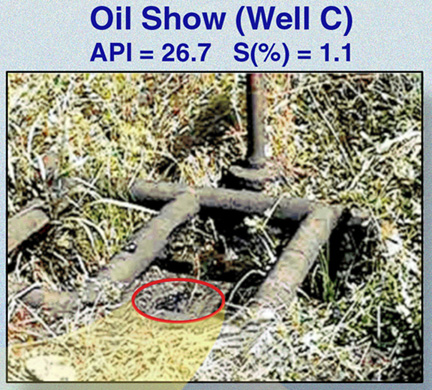
API=26.7 S%=1.1
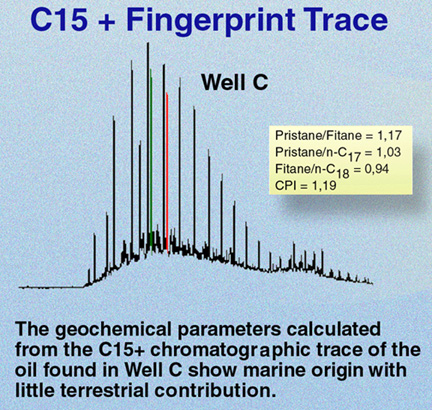
The geochemical parameters calculated from the C15+ chromatographic trace of the oil found in Well C show marine origin with little terrestrial contribution.
Illustrations
Surface
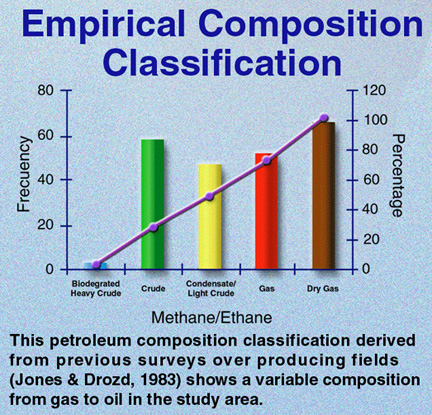
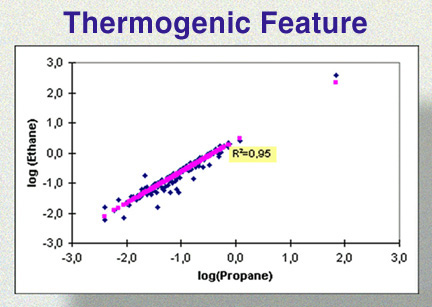
Empirical Composition Classification
This petroleum composition classification derived from previous surveys over producing fields (Jones and Drozd, 1983) shows a variable composition from gas to oil in the study area.
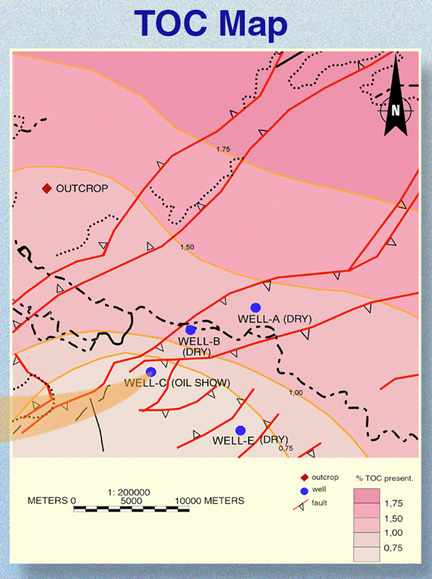
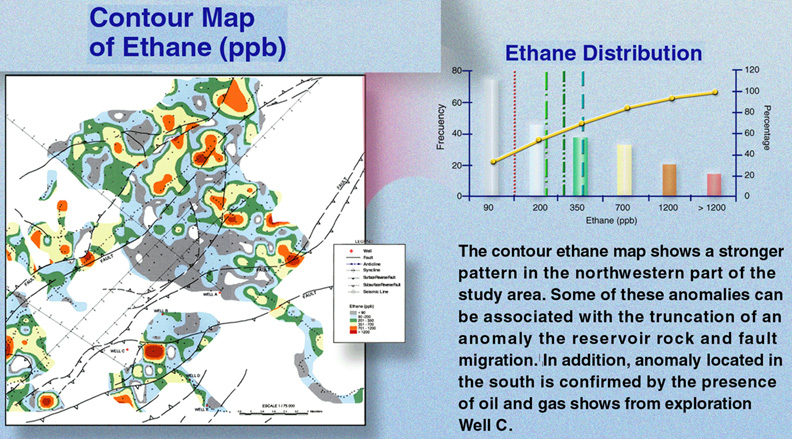
The contour ethane map shows a stronger pattern in the northwestern part of the study area. Some of these anomalies can be associated with truncation of the reservoir rock and fault migration. In addition, anomaly located in the south is confirmed by the presence of oil and gas shows from exploration Well C.
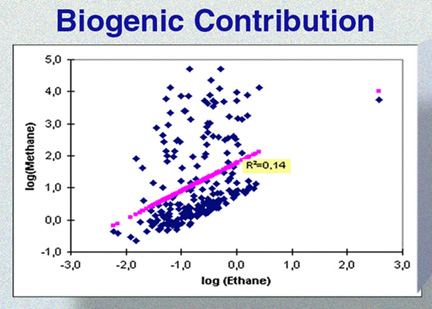
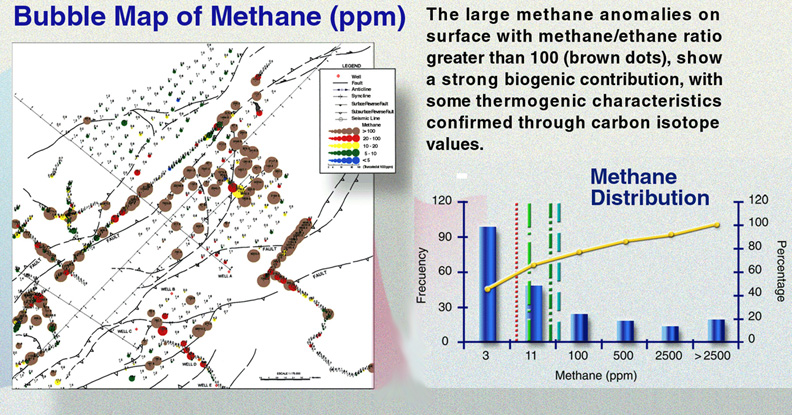
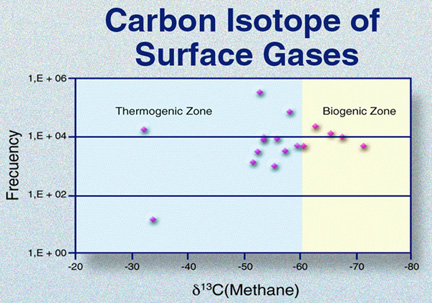
The large methane anomalies on surface with methane/ethane ratio greater than 100 (brown dots), show a strong biogenic contribution, with some thermogenic characteristics confirmed through carbon isotope values.
Illustrations
Empirical Composition Classification
Statistical Values of Surface Gases
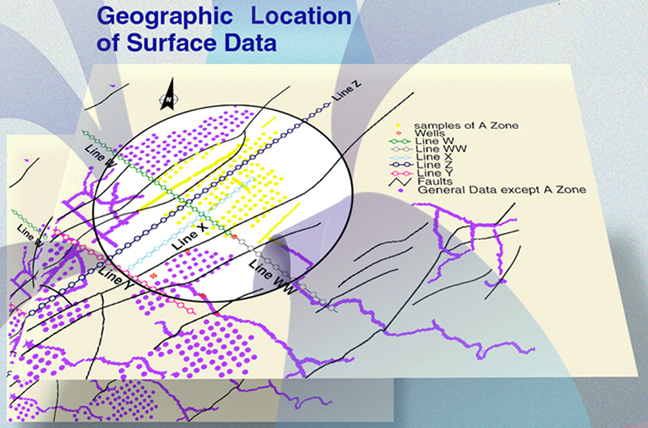
Geographic Location of Surface Data
Carbon Isotope of Surface Gases
Integration
Structural Map & Ethane Contour Map (Escandalosa Formation)
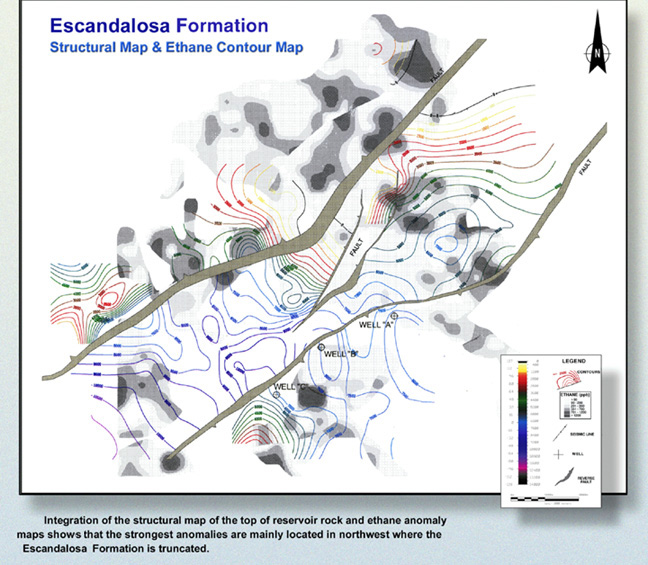
Integration of the structural map of the top of reservoir rock and ethane anomaly maps shows that the strongest anomalies are mainly located in northwest where the Escandalosa Formation is truncated.
Axial Surface Map & Bubble Map of Methane
Integration of the axial surface and methane anomaly maps shows the agreement between some methane anomalies (with intermediate composition) and the violet and magenta structural trends. Nevertheless, the violet trend does not have structural closure. The magenta trend has not been completely interpreted to the northeastern part of the area due to the lack of seismic information.
Ethane Profiles
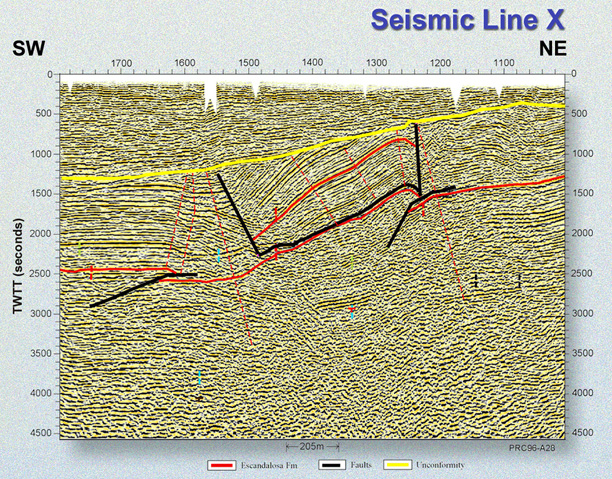
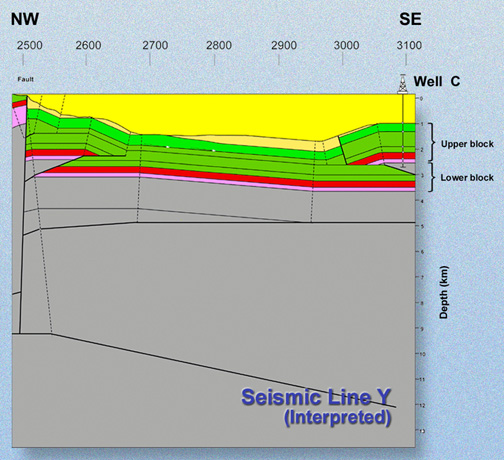
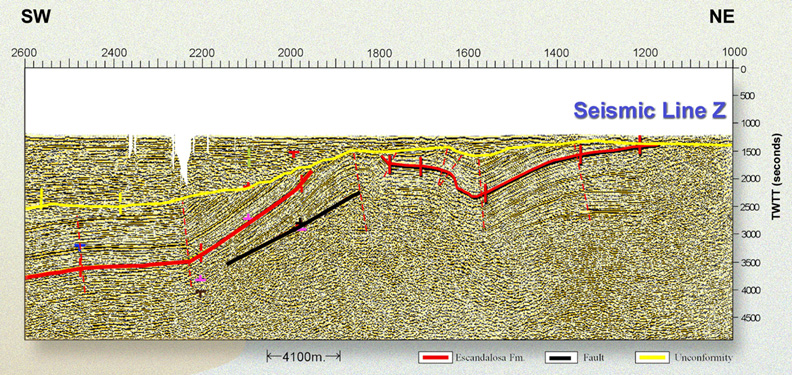
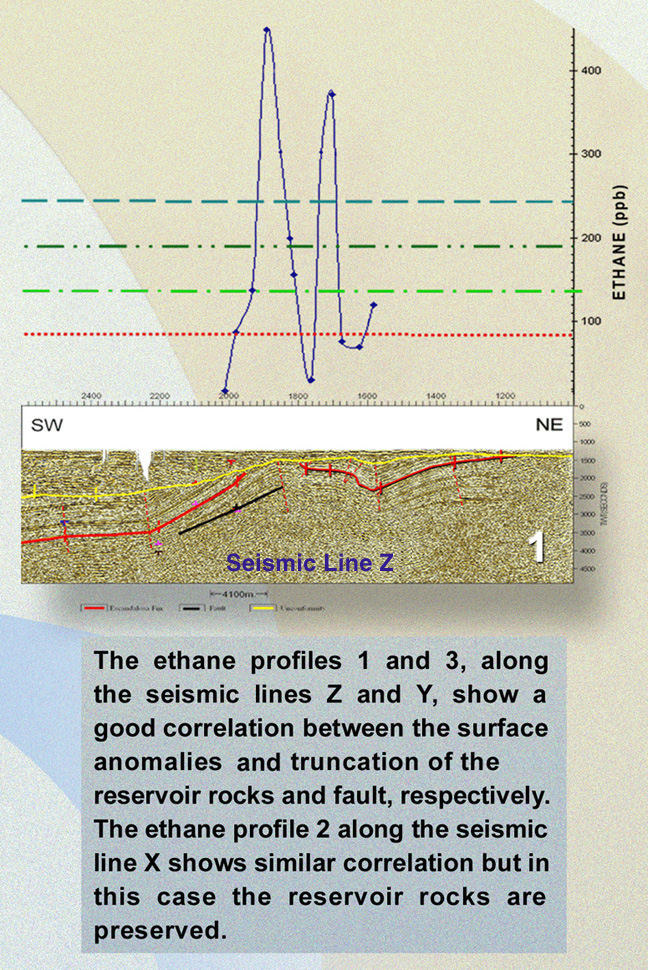
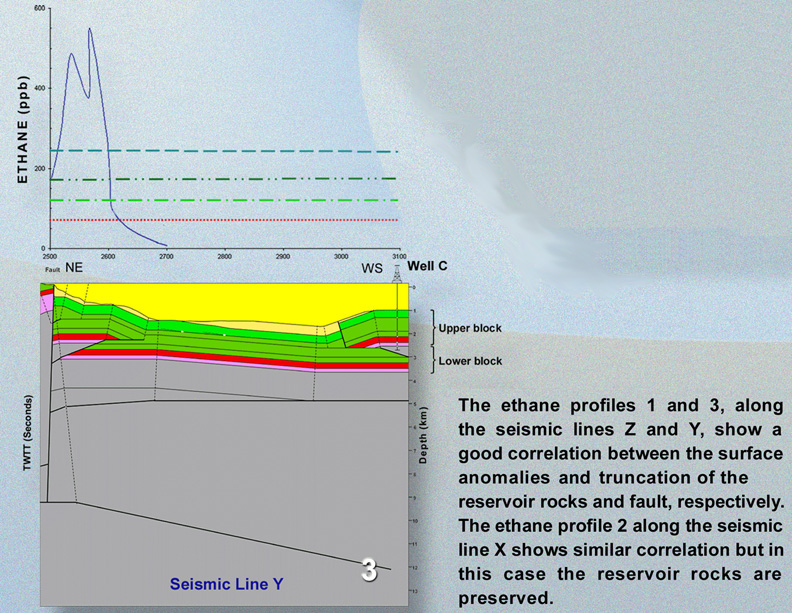
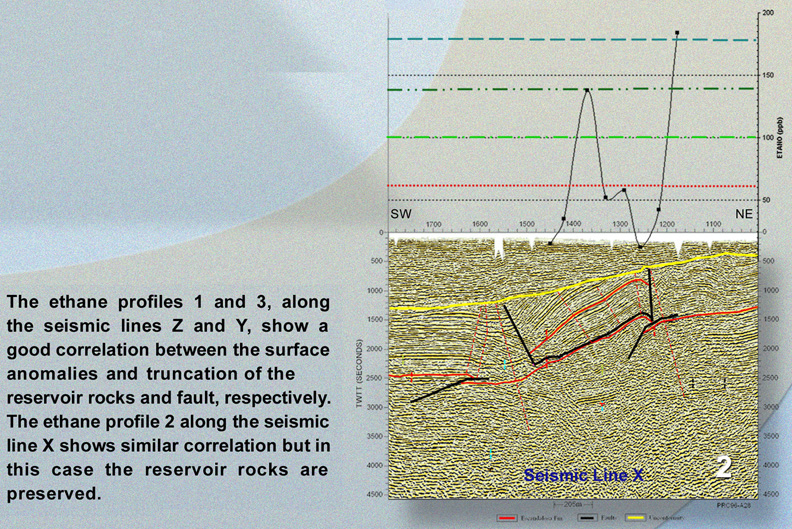
The ethane profiles 1 and 3, along the seismic lines Z and Y, show a good correlation between the surface anomalies and truncation of the reservoir rocks and fault, respectively. The ethane profile 2 along the seismic line X shows similar correlation, but in this case the reservoir rocks are preserved.
The petroleum system was affected by three erosion events, the most important being the Eocene event. The hydrocarbon generation started at this time but probably did not reach enough maturity for significant oil expulsion. Nevertheless, the small quantities of oil in exploration Well C are probably driven by the powerful hydrogeological system of the area.
Illustrations
Structural Map & Ethane Contour Map (Escandalosa Formation)
Axial Surface Map & Bubble Map of Methane
Ethane Profile along Seismic Line Y
Ethane Profile along Seismic Line Z
Ethane Profile along Seismic Line X
Conclusions
-
Biomarker analysis suggests that the small volume of oil found in the area was produced by early generation of hydrocarbons at the beginning of the oil window.
-
The seepage magnitudes show an important biogenic contribution.
-
The strongest thermogenic surface anomalies are mainly located in northwestern part of the study are, where the reservoir rock is truncated.
-
The agreement between some methane anomalies (with intermediate composition) and structural trends interpreted from axial surface analysis suggests that there is some contribution of thermogenic processes probably from early generation of a Cretaceous source rock.
-
Structural truncation of the main exploratory objective and low maturity of organic-rich intervals indicate high exploration risk in the study area.
-
Combining axial surface map analysis and surface geochemistry helped to prioritize prospective areas for petroleum exploration.
References
Shaw, J., Hook, S.C., and Suppe, J., 1994, Structural trend analysis by axial surface mapping: AAPG Bulletin, v. 78, p. 700-721.
Jones, V., and Drozd, R., 1983, Predictions of oil and gas potential by near-surface geochemistry: AAPG Bulletin, v. 67, p. 932-952.
Cassani, F., Gallango, O., Talukdar, S., Valiegos, C., and Ehrmann, Ursula, 1987/1988, Methylphenanthrane maturity index of marine source rock extracts and crude oils from Maracaibo Basin; Organic Geochemistry, v. 13, p. 73-80.