![]() Click to view this article in PDF format.
Click to view this article in PDF format.
Geologic Study of the Miocene Rodador Field and its Exploitation Possibilities, Tabasco State, Southeastern Mexico*
By
Francisco Javier Martínez Castillo1
Search and Discovery Article #20008 (2002)
*Adapted for online presentation from article of the same title by the same author published in AAPG Memoir 75 (p. 433-441), which may be purchased from the AAPG Bookstore (http://bookstore.aapg.org). Published at the end of 2001, Memoir 75 is entitled The western Gulf of Mexico Basin: Tectonics, sedimentary basins, and petroleum systems; it was edited by C. Bartolini, R.T. Buffler, and A. Cantú-Chapa.
1PEMEX Exploración y Producción, Agua Dulce, Veracruz, Mexico.
Abstract
The interpretation and analysis of depositional systems played an important role in the definition of hydrocarbon reservoirs in the Rodador field of the Isthmian Saline Basin in southeastern Mexico. The two major sandstone reservoirs of the middle Miocene-lower Pliocene Encanto Formation, which are referred to as the 17-A and 18 sands, are located at depths ranging from 2873 m to 2995 m and 2877 m to 3031 m, respectively. The thickness of these two sands ranges from 8 m to 28 m (17-A) and from 7 m to 48 m (18).
The stratigraphic distribution of the hydrocarbon reservoir units and seal rocks has been established, allowing the identification of new potential areas for exploitation. The prograding complex of the Encanto Formation is the most attractive from a petroleum perspective, because it hosts the hydrocarbon-producing Rodador field. A detailed analysis of sand-top maps in this study was used to estimate the original hydrocarbon volume in place, to rank the potential areas for new exploitation plans in the Rodador field. Calculated hydrocarbon reserves are not included in this paper.
|
tAbstracttPrevious studies
tAbstracttPrevious studies
tAbstracttPrevious studies
tAbstracttPrevious studies
tAbstracttPrevious studies
tAbstracttPrevious studies
tAbstracttPrevious studies
|
Click here for sequence of Figure 7a and Figure 8a.
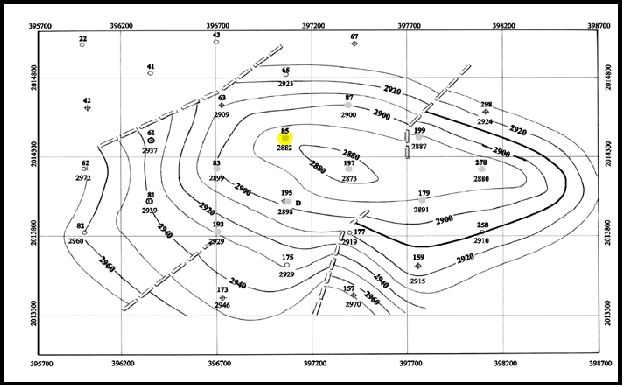
IntroductionThe Rodador field is in the state of Tabasco, southeastern Mexico. This field is in the onshore portion of the Isthmian Saline Basin, part of the province known as the Southeastern Tertiary Basins (Figure 1). The purpose of this study is to estimate the original hydrocarbon volume in place, which will be used to rank the potential of the sands for new exploitation plans. The sequence-stratigraphic concepts and terminology used in this study are based on Van Wagoner et al. (1988, 1990) and Mitchum et al. (1993). Seismic line L-64/39 is crucial to the study, because it crosses through wells Rodador 173, 175, 177, 179, and 278 (Figures 2 and 3). The study includes 25 well logs (Figure 2), as well as the stratigraphic data from the Ají-1 well, located to the southwest of the field (1.4 km S29°W of the Rodador-1 well). The Ají-1 well was chosen because cutting samples from 1900 m to 3835 m contain fossils that were studied by Rodríguez (1999), who identified the species outlined in Table 1. Based on well logs, the top of the Encanto Formation is established at the contact of a shalier section with a sandier one. According to correlation of well logs and supported by paleontological data furnished by the Rodador-195D well drilled in 1997, the top of the Encanto Formation was established with the following microfossils: Uvigerina hispida, Reophax encantoensis, and Melonis pompilioides. Previous StudiesBy 1953, several unpublished gravity, refraction, and reflection seismology surveys had resulted in identification of several geologic blocks considered to be attractive for oil exploration. Jiménez (1976) interpreted the northern portion of the Rodador field to evaluate available commercial hydrocarbon reservoirs. His study defined the structure as a faulted anticline with a southeast-northwest-trending axis. The long axis of the structure measures 3 km, and the width measures about 2 km. It has a small closure dipping to the northwest. This study encompasses the southern area of the field and concurs with Jiménez (1976) in that the cumulative sand horizons in the southeastern part of the field appear to be better developed. The maps of sand tops provided in this study indicate that these sand bodies are potential reservoirs. Guerrero (1993) estimated the original hydrocarbon volume and reserves for the Rodador field. He proposed the existence of eight reservoirs divided into 18 blocks in the Encanto Formation. These reservoirs are at depths that range from 2400 m to 3450 m. The Discovery of the Rodador FieldThe Rodador field was discovered by wildcat Rodador-1 in 1971. This well was drilled to a depth of 3647 m and became a dual producer of oil and gas from intervals 3220-3228 m and 3458-3470 m. These intervals correspond to middle Miocene-lower Pliocene sand bodies of the Encanto Formation. The Rodador field was developed mainly to the south and southeast of the Rodador-1 well. Forty-six wells had been drilled by 1980, of which 36 were producers and 10 were dry (Figure 2). The spacing between wells was 400 m. Seismic AnalysisOnly seismic line L-64/39, which crosses the field in a southwest-northeast direction (Figure 2), was analyzed. This line ties to wells Rodador 173, 175, 177, 179, and 278 (Figure 3). The velocity survey used was that of the Magallanes-850 well, about 10 km southeast of Rodador field. This velocity survey was used to convert the seismic reflections from time to depth and to try to calibrate the seismic information with the wells, because the Rodador field does not have its own velocity survey. Anhydrite and Salt in Rodador FieldJurassic anhydrite and salt are common in the Southeastern Tertiary Basins of southern Mexico. In Rodador field, 10 wells (Rodador 1, 2, 6, 20, 31, 32, 43, 52, 54, and 173) reached the anhydrite-salt top. These wells penetrated from 1 m below the top (Rodador-54) to 35 m (Rodador-6) and from 3453 m minimum depth (Rodador-173) to 3791 m maximum depth (Rodador-6). The Ají-1 well in the southwestern area reached the anhydrite top at 3853 m, penetrating 17 m. Seismic Line L-64/39On seismic line L-64/39, at the position of wells 175 and 173 at approximately 2.1 to 2.3 s (equivalent to 2690 to 3010 m in depth), the following can be observed (Figure 3): 1) The pattern of imbricated turbiditic flows deposited on the slope forms stratigraphic traps in the Encanto Formation. 2) The line drawn across the lower part of wells Rodador 173, 175, 177, 179, and 278 corresponds to the base of the Encanto Formation at 2.48 s (3360 m) for Rodador-173 and at 2.55 s (3430 m) for Rodador-278. These lower sands are better developed than in the northern producing portion of the field. Below the base of the Encanto Formation, the section becomes more shaly. 3) Southwest of seismic line L-64/39 (Figure 3), from approximately 1.8 to 2.4 s, the seismic reflections are seen to rise upward, produced by the Cinco Presidentes salt dome to the southeast (Figure 1). 4) The main producing area with exploitation possibilities is located in the 2.0- to 2.5-s interval, from 2500 m to 3350 m deep. These producing intervals belong to the middle and lower part of the Encanto Formation, as illustrated on seismic line L-64/39 (Figure 3). Note that the 850-m thickness of the producing zone is a gross thickness, representing interbedded layers of sand and shale. GeologyDepositional Model of the Producing HorizonsThe Encanto Formation consists of interbedded sand and shale. Both lithologies have variable thickness through the formation. The thickness of the sand bodies ranges from 4 m to 65 m, and the thickness of shale horizons ranges from 3 m to 67 m. The sand is light to dark gray in color, fine- to coarse-grained, and the shale is soft to hard, green and dark gray. The Concepción Inferior Formation overlies the Encanto Formation and is characterized by interbedded thick-shale and thin-sand bodies. This formation in the study area has an average thickness of 260 m. Based on a correlation of electric logs, the top of the Encanto Formation is characterized by the presence of interbedded, well-defined sand and shale bodies located at an average depth of 2240 m (Figure 4). The Encanto Formation in the study area has a minimum thickness of 1205 m (Rodador-67 well) and a maximum thickness of 1376 m (Rodador-177 well). The Ají-1 well, southwest of the field and 1.4 km southwest of the Rodador-1 well (Figure 2), penetrated 1468 m of Encanto Formation before encountering the top of the anhydrite. On the basis of well logs, the base of the Encanto Formation is established at the contact of a sandier section with a shalier one. Most of the oil produced from the Encanto Formation in southeastern Mexico is from shingled turbidites (PEP-BP Exploration Report, 1994). The producing and potential turbidite sands are found mainly in the middle and lower portions of the Encanto Formation. In the southern area of Rodador field, two prograding complexes, referred to as A and B, have been recognized as part of the Encanto Formation (Figures 5 and 6). Prograding complex A in the lower and middle portions of the Encanto Formation includes the 31 to 13 sands at depths ranging from 2700 m to 3450 m and whose thickness varies from 5 m to 69 m. Sands 22 to 17 (except 19) (Figure 5 and 6) show a good resistivity curve response because of the presence of hydrocarbons, and thus they have exploitation possibilities. Sand 17-A has been tested in wells 81, 82, and 175, and it also has good possibilities in nine more wells (83, 85, 87, 179, 193, 195D, 197, 199, and 278) (Figure 7). The 18 sand in wells 195D and 278 is the main producer in the field. The sand has a good response on the log resistivity curve (well 278), and has an average thickness of 33 m and an average porosity of 22%. It is considered a potential future producer in wells 83, 85, 87, 179, 197, and 199 (Figure 8). Prograding complex B comprises the sand bodies at depths of 2200 m to 2650 m. This is the shallowest complex, and it encompasses sands 12 to 8, whose thickness varies from 8 m to 65 m. Sand 12 in the Rodador-258 well has yielded good oil production and has exploitation possibilities in well 179 (Figure 9), as indicated by a high resistivity curve response. The 12 sand in well 179 reaches a gross thickness of 65 m. It is important to mention that in the Rodador field, there are intervals with exploitation possibilities, and they are shown with well logs in Figure 10. Figure 11 depicts a conceptual sedimentary model of the Rodador field, showing the approximate location of the field in the prograding complex. Reservoir RocksHydrocarbon reservoirs are typically fine- to medium-grained gray sands, some of which are shaly. Coarse-grained sand rarely occurs in the formation. In the study area, sand reservoirs vary in thickness from 3 m to 33 m and have an average porosity of 20%. Seal RocksSeal rocks in the Rodador field are shales of variable thickness interbedded with the reservoir sands of the Encanto Formation. In some cases, lateral seals are faults or changes in sedimentary facies (Figure 12; wells Rodador 63, 85, 197, 179, and 258). An example of a lateral fault seal is clearly seen between wells 179 and 258, where the impregnation of sand A-11 in well 179 no longer appears in well 258. An example of facies-change, lateral seal is shown where a sand body immediately below sand A-26 in well 197 becomes shalier toward well 179. Finally, a pinch-out lateral seal is illustrated with sands A-25 and A-26, where the pinching out of the sands acts as a seal. TrapsTraps are mainly stratigraphic as a result of pinch-outs of sand bodies, as illustrated in Figure 12, where sands A-25 and A-26 pinch out to form traps. Structural and combination traps also occur between wells 179 and 278 for sand A-11. Conclusions1) Optimal hydrocarbon production in the Rodador field is from a prograding complex in the middle Miocene-lower Pliocene Encanto Formation. 2) The study area is not strongly affected by structural deformation; traps are mainly stratigraphic. 3) A conceptual sedimentary model for the Rodador field is proposed here on the basis of a multidisciplinary study. 4) The detailed analysis of sand-top maps was used to estimate the original hydrocarbon volume in place, and this helps to rank the areas or sand bodies for exploitation purposes. The calculated hydrocarbon reserves will remain confidential. AcknowledgmentsI thank Dr. Abelardo Cantú-Chapa (Instituto Politécnico Nacional) for his suggestions for improving the manuscript. I also thank Petróleos Mexicanos, Activo de Producción Cinco Presidentes, Area Diseño de Explotación, Agua Dulce, for permitting me to publish this paper. References CitedBerggren, W. A., V. K. Dennis, C. Swisher, and M. P. Aubry, 1995, A revised Cenozoic geochronology and chronostratigraphy, in Geochronology time scales and global stratigraphic correlation: Society for Sedimentary Geology (SEPM) Special Publication 54, p. 129-212. Guerrero, C. G., 1993, Cálculo del Volumen Original y Reservas de Hidrocarburos del Campo Rodador: PEMEX confidential report, p. 2. Jiménez, T. A., 1976, Interpretación Geológica Campo Rodador: PEMEX confidential report, chapter 1, p. 1-11. Mitchum, R. M., J. B. Sangree, and P. R. Vail, 1993, Recognizing sequences and systems tracts from well logs, seismic data, and biostratigraphy: Examples from the late Cenozoic of the Gulf of Mexico, in P. and H. W. Posamentier, eds., Siliciclastic sequence stratigraphy: Recent developments in applications: AAPG Memoir 58, p. 163-189. Partida, M. P., and M. J. A. Zaldivar, 1997, Revisión Paleontológica del Pozo Rodador-1950: PEMEX confidential report. PEP-BP Exploration, 1994, Proyecto Cuencas Terciarias del Sureste y Área Marbella, chapter 3, p. 37; chapter 4, p. 60-63, 139; chapter 5, p. 142-144, 148-149. Rodríguez, C. R. L., 1999, Revisión Paleontológica del Pozo Ají-1: PEMEX confidential report. Van Wagoner, J. C., R. M. Mitchum, K. M. Campion, and V. D. Rahmanian, 1990, Siliciclastic sequence stratigraphy in well logs, cores, and outcrops: Concepts for high-resolution correlation of time and facies: AAPG Methods in Exploration Series No. 7, 55 p. Van Wagoner, J. C., H. W. Posamentier, R. M. Mitchum, P. R. Vail, J. F. Sarg, J. S. Loutit, and J. Hardenbol, 1988, An overview of the fundamentals of sequence stratigraphy and resolutions definitions, in C. K. Wilgus et al., eds., Sea-level changes: An integrated approach: Society for Sedimentary Geology (SEPM) Special Publication 42, p. 38-45. |
 Figure
 Figure
 Figure