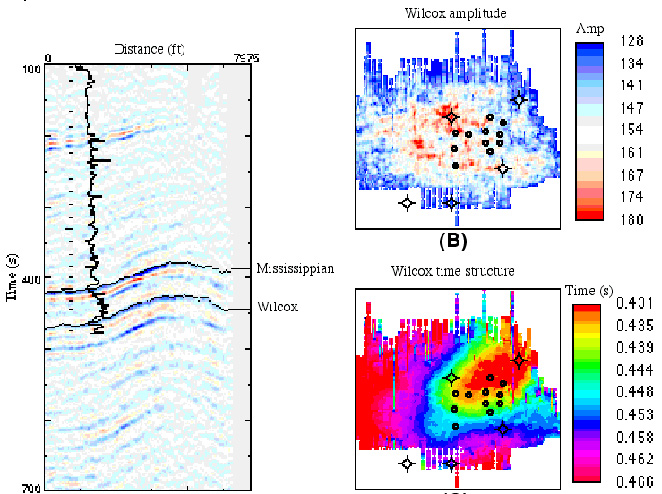
Figure 19. Seismic tracking, illustrated by seismic profile with tracked events and overlay of time-plot of sonic log (left); Ordovician Wilcox amplitude and time structure maps on right (from Liner, 1999).
Figure 19. Seismic tracking, illustrated by seismic profile with tracked events and overlay of time-plot of sonic log (left); Ordovician Wilcox amplitude and time structure maps on right (from Liner, 1999).