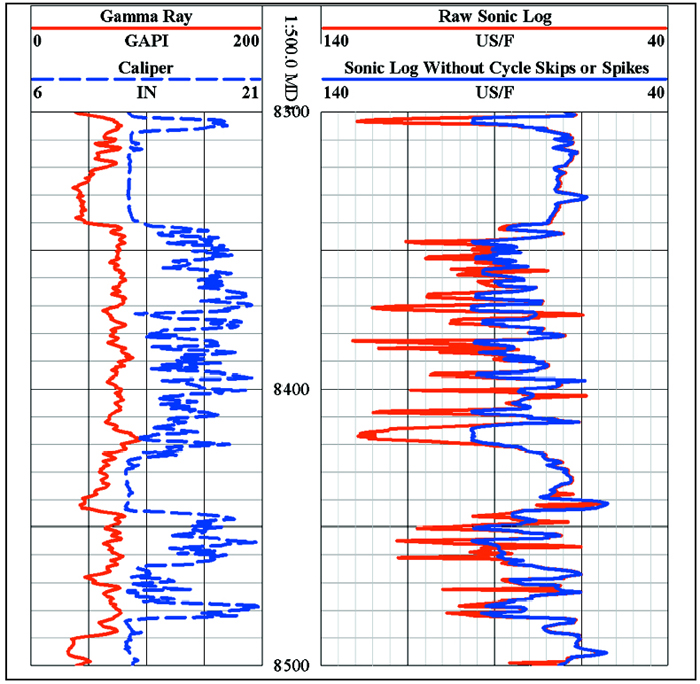
Figure 1. Comparison of a raw sonic log (red curve, right track) that has problems with cycle skips and noise due to the poor borehole condition, and the same sonic log after replacement (blue curve, right track) of bad data with pseudo sonic data modeled from the conductivity. Note the poor borehole condition as seen on the caliper log (left track).