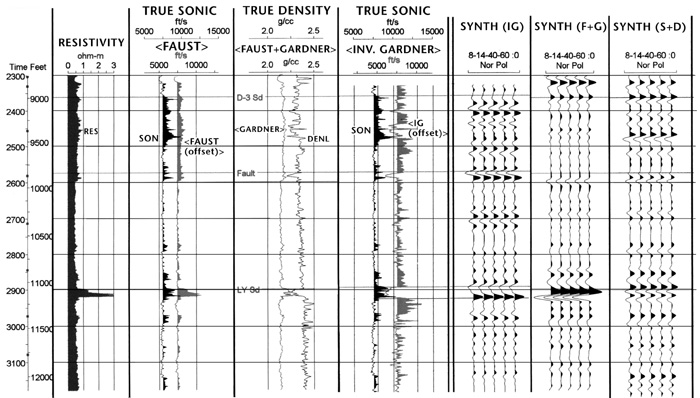
Figure 5: Comparison of three synthetic seismograms for a deep Yegua well. The left-hand panels show the comparison of true sonic and density and the logs calculated using Faust, Gardner and Inverse Gardner (IG). All logs and synthetics are displayed in time and are corrected by velocity survey (the uncorrected IG-sonic was considerably too high). The deep, porous gas sandstone depresses density but not sonic, leading to errors using IG.