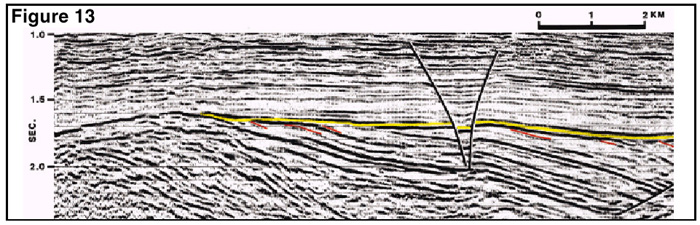
Figure 13: Partial seismic line illustrates the truncation, facies pinch-out and the potential hydrocarbon traps illustrated in figures 9-10 and 12. This comparison of outcrop and seismic data demonstrates the need for the outcrop model to interpret the seismic geometry and predict facies correctly.