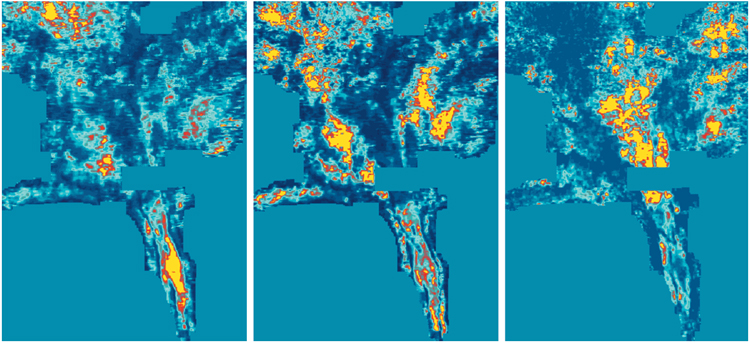
Figure 3 – Three successive spectral decomposition images showing the different parts of the reservoir being highlighted by different frequency bands. Thicker on the left, thinner on the right.
Click to view sequence highlighting different parts of reservoir (thicker to thinner).