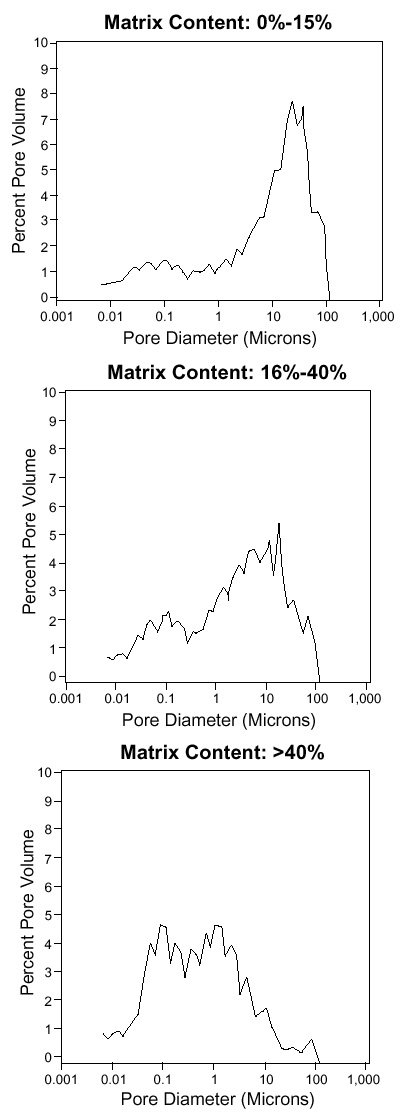
Figure 13. Examples of pore throat size (diameter, in microns) distribution plots for 3 representative Arab-D samples. These plots illustrate the overall distribution of pore sizes, and how the dominant pore sizes (peaks) shift, as mud content increases.