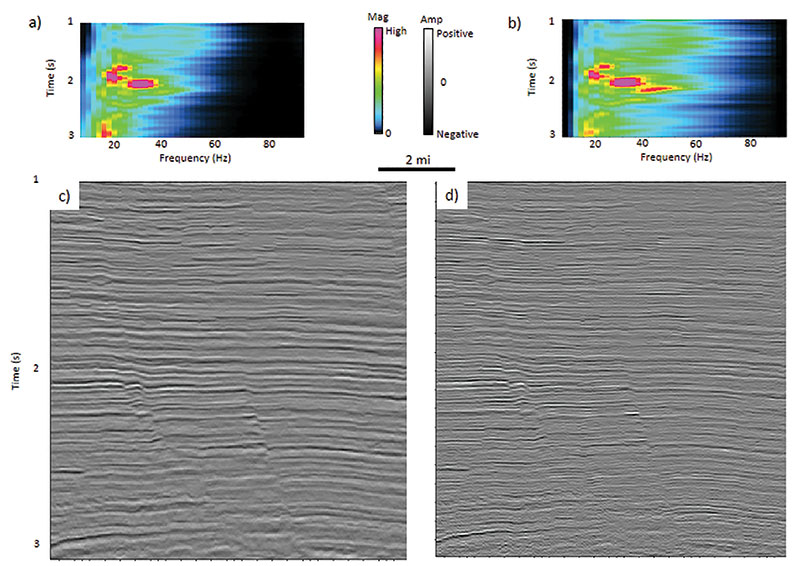
Figure 3. Average time-frequency spectra of a legacy ocean-bottom cable data volume (a) before, and (b) after applying the spectral balancing and bluing workflow shown in Figure 2. Bluing factor β = 0.3 and smoothing window = 0.5 s. Representative vertical slices through the seismic data (c) before, and (d) after spectral balancing and bluing. The actual spectra of these slices are different from the average spectra.