![]() Click to view article in PDF format.
Click to view article in PDF format.
GCQuantitative Curvature Analysis: A Case Study*
Evan Staples1, Ze’ev Reches2, and Kurt Marfurt2
Search and Discovery Article #41180 (2013)
Posted August 26, 2013
*Adapted from the Geophysical Corner column, prepared by the authors, in AAPG Explorer,August, 2013.
Editor of Geophysical Corner is Satinder Chopra ([email protected]). Managing Editor of AAPG Explorer is Vern Stefanic
1ConocoPhillips, Houston, Texas
([email protected])
2University of Oklahoma, Norman, Oklahoma
In our prior article, (Search and Discovery Article #41147) we analyzed the relations of fracture patterns and layer curvature in clay models. Here we examine these relations in a central Oklahoma field developed by Pathfinder Exploration of Norman, Oklahoma. The dolomitized reservoir is 50-100 feet thick within the Hunton Group of Late Ordovician to Early Devonian age. The data include a 3-D time-migrated seismic survey of about nine square miles, and 15,622 feet cumulative length of image-logs in seven horizontal wells.
|
|
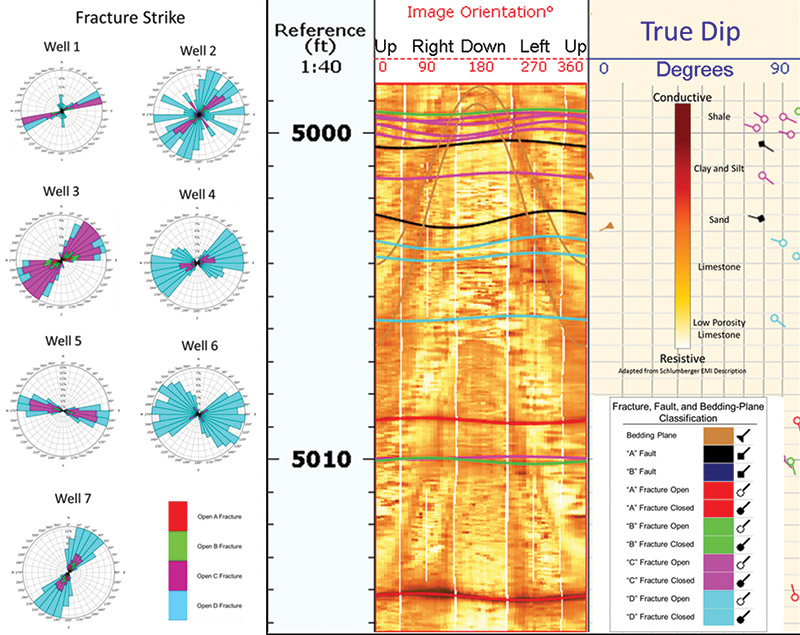
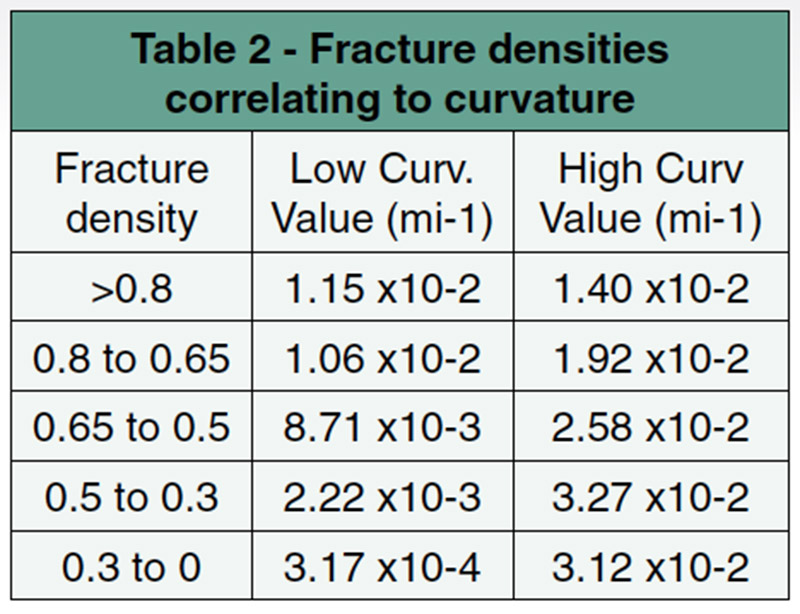
The interpreted image logs (Figure 1) of all wells revealed 3,971 fractures, as well as bedding surfaces and fault zones. The majority of the fractures are sub-vertical to vertical, and their strike orientations are plotted with color-coding of our quality ranking (A to D) based on visual quality and continuity (Figure 1, left portion). Fracture density was binned in 55-foot bins, which are half the size of 110-foot 3-D seismic bins, for comparison between fracture density and seismic attributes. We assumed that lithological and thickness variations within the horizontal wellbores are minimal. The fracture orientations are fairly scattered, yet three major trends can be recognized (Figure 1, left): 1) A scattered ENE-WSW trend in wells 1, 2, 3 and 4. 2) A scattered ESE-WNW trend in wells 5 and 6. 3) A NNE-SSW trend in well 7. We test the hypothesis that the fractures formed primarily as tensile fractures due to local curvature (see prior article Search and Discovery Article #41147), and compare their density to the 3-D seismic curvature. Figure 2 (left) shows a top Hunton horizon slice through the most-positive curvature volume. The horizontal wells are displayed with color-coded fracture density (fracture number/55-foot length). Figure 2 (left) displays a few areas of good correlation between high fracture density and high most-positive curvature values (yellow arrows). In the next step (Figure 2, right), the strike direction for high curvature values are plotted with color denoting the direction as shown by the time slice. The general E-W strike directions of the curvatures appear to correspond with the high fracture densities in wells 3-7 (Figure 1, left). Wells 1 and 2 do not cross areas with curvature zones of E-W strike directions. To further examine the correlations between fractures and the curvature, we used a workflow for azimuthally-limited weighted average of curvature features from the 2010, 80th Annual International Meeting of the SEG entitled Seismic attribute illumination of Woodford Shale faults and fractures, Arkoma Basin, Oklahoma, by Guo and Marfurt. Azimuthal intensity is: [total strike length] / [total area of the search window] This technique is similar to fracture intensity calculations in part one, but filters curvature strike direction by azimuth. We calculated azimuthal intensity in 15-degree sections and correlated them to fracture densities in the image-logs; high correlation exists where “r” approaches unity (Table 1). For example, the interpreted fractures in well 3 strike 30-90 degrees (Figure 1, left), and we found high correlation between fracture density and the azimuthal intensity at 45 degrees and 75 degrees, which are within the range of the interpreted fractures. One should note that these high correlations are localized only in areas of high curvature, and do not exist along the entire wellbore. The other wells, excluding well 1, exhibited similar behavior of areas with high fracture density and high curvature, and also had high correlation with one or more trends of azimuthal intensity. In the compressional clay experiments of our prior article (Search and Discovery Article #41147) we found that a critical magnitude of the curvature is needed to generate tensile fractures – and below this critical curvature there was no correlation between curvature and fractures. We think that a similar situation occurs in the horizontal wells: areas of high correlation between azimuthal intensities and fracture density also show that most-positive curvature values highly correlate with fracture densities. To identify the critical curvature magnitude in the present 3-D seismic area, we took the areas of high correlation between azimuthal intensity and fracture density in the wells and computed the curvature ranges for each high correlation interval. We then link them to the fracture density range (Table 2). It appears that the critical magnitude of curvature in the study area is between 8.71x10⁻³ mi-1 and 2.58x10⁻² mi-1 as these ranges of curvature correspond to fracture densities > 0.5 (fracture/feet), suggesting that curvature induced most of these fractures. Outside this curvature range the fracture densities are too low to be clearly correlated to the curvature. We thus propose that the azimuthal intensity method can help to identify locations where curvature strike orientations in the subsurface appear to be locally related to fracture density. Our main conclusions are: Acknowledgements Thanks to Pathfinder Exploration for providing the data used in this project, and to Schlumberger for providing software for this research at the University of Oklahoma. |
 General statement