--> Testing Curvature’s Impact on Fractures, by Evan Staples and Kurt Marfurt; #41147 (2013).
[First Hit]

Datapages, Inc.Print this page

Click to view article in PDF format.


GCTesting Curvature’s Impact on Fractures*


Evan Staples1 and Kurt Marfurt2


Search and Discovery Article #41147 (2013)

Posted July 22, 2013


*Adapted from the Geophysical Corner column, prepared by the authors, in AAPG Explorer, July, 2013.
Editor of Geophysical Corner is Satinder Chopra ([email protected]). Managing Editor of AAPG Explorer is Vern Stefanic


1ConocoPhillips, Houston, Texas  ([email protected])
2University of Oklahoma, Norman, Oklahoma


General Statement

Fracture zones can be critical to improving or creating sufficient porosity and permeability in hydrocarbon reservoirs - with strain, along with lithology and thickness being the major controls. In this article we will use layer curvature as a proxy for strain induced by layer bending. We test our hypothesis using small-scale clay models, which provide a time history of folding and fracturing, and are commonly considered analogs for large-scale field structures. The experimental apparatus consisted of a horizontal table with one moveable sidewall, one stationary sidewall and a deforming base.

We present four Previous HitexperimentsNext Hit - one extensional and three compressional.
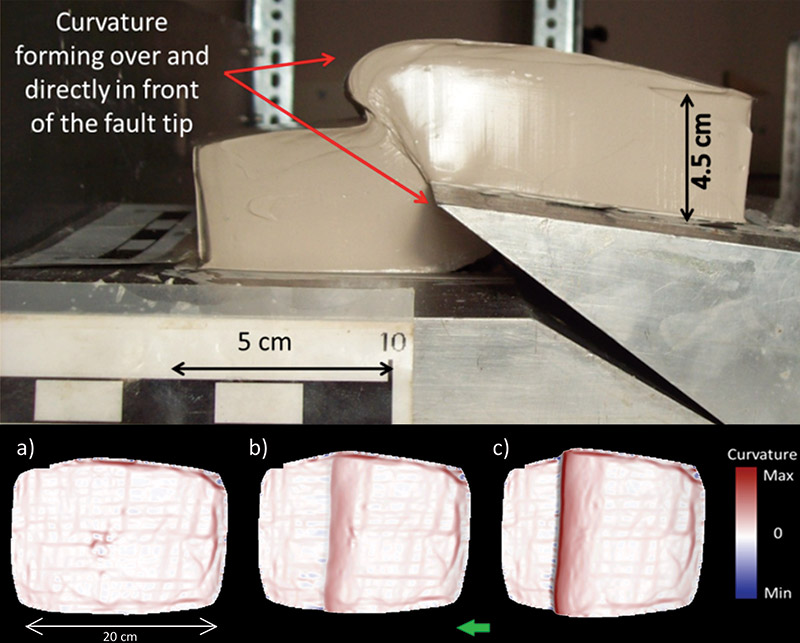
  • In the extensional experiment, the clay cake was placed on top of two rigid, thin metal plates that were moved away from each other.
  • In the compressional Previous HitexperimentsNext Hit, the clay cake was placed on two metal wedges with inclinations 45 degrees, 30 degrees and 15 degrees, that moved toward each other to generate reverse basement faulting.
  • General statement

    Figures

    Clay Previous HitmodelNext Hit Previous HitexperimentsNext Hit

    Extensional Experiment

    Compressional Previous HitExperimentsNext Hit

    Conclusion

    Acknowledgments


    General statement

    Figures

    Clay Previous HitmodelNext Hit Previous HitexperimentsNext Hit

    Extensional Experiment

    Compressional Previous HitExperimentsNext Hit

    Conclusion

    Acknowledgments


    General statement

    Figures

    Clay Previous HitmodelNext Hit Previous HitexperimentsNext Hit

    Extensional Experiment

    Compressional Previous HitExperimentsNext Hit

    Conclusion

    Acknowledgments


    General statement

    Figures

    Clay Previous HitmodelNext Hit Previous HitexperimentsNext Hit

    Extensional Experiment

    Compressional Previous HitExperimentsNext Hit

    Conclusion

    Acknowledgments

    Figure Captions

    Figure 1. (Top) Side view of clay cake deformed during extensional experiment. (Bottom) Most-positive curvature computed from the undeformed to final stage of extension experiment a-c. Subtle curvature anomalies parallel and perpendicular to the fault correlate to tool marks made in the initial clay Previous HitmodelNext Hit construction. Fracture intensity calculations occurred on the left side of the central graben. The top of the Previous HitmodelNext Hit is to the left as indicated by the green arrow.

    Figure 2. (Top) Side view of anticline generated during compressional 30-degree ramp experiment. (Bottom) Most-positive curvature computed from undeformed to final of compressional 30-degree ramp experiment a-c. Subtle curvature anomalies parallel and perpendicular to the fault correlate to tool marks made in the initial clay Previous HitmodelNext Hit construction. Fracture intensity calculations occurred on the top of the anticline. The top of the Previous HitmodelNext Hit is to the left as indicated by the green arrow.

    Figure 3. Linear relationship observed between fracture intensity and curvature, with standard error bars for all four Previous HitexperimentsNext Hit.

    Clay Previous HitModelNext Hit Previous HitExperimentsNext Hit

    We use wet clay with dimensions of 20 centimeters long, 15 centimeters wide and five centimeters thick. A laser scanner positioned above the clay cakes captured 3-D surface images. A typical experiment lasted approximately 30 minutes with a laser scan occurring every two minutes; this short duration eliminated clay drying as a variable.

    The curvature of the clay surface was calculated from the laser scans using commercial software, and the fractures were mapped on digital photographs of the clay surface. Curvature over the deformation area was calculated in each stage by placing three polygons at fixed locations and averaging the curvature within each polygon. The fracture intensity (FI) was calculated for these polygons by dividing total measured fracture length in each polygon by its area.

    Extensional Experiment

    In the extensional experiment, a basin formed above the moving plates with a synthetic normal fault on one side, and a system of antithetic-normal faults, fractures and a flexure on the other side (top of Figure 1). Curvature and fracture intensity measurements were conducted on the later side of the basin. The bottom of Figure 1 displays a suite of positive curvature images from initial through final stages.

    Fractures were first visible on the clay surface with a measured curvature of 2.53 x 10⁻³ cm-1. We observed that curvature and fracture intensity increased with time, but was dependent on fault movement. Normal faults started as individual segments and eventually joined up to form faults that spanned the entire clay Previous HitmodelNext Hit. At a critical point, fractures no longer accommodated the displacement; rather, normal faults accommodated displacement in the Previous HitmodelNext Hit. At this point, we ended the experiment.

    Compressional Previous HitExperimentsNext Hit

    In the three compressional Previous HitexperimentsNext Hit, an anticline developed with fractures on the crest sub-parallel to the axial plane (top of Figure 2). Fractures were first visible on the clay surface with curvature ranging between 1.40 x 10⁻² cm-1 to 2.13 x 10⁻² cm-1. The bottom of Figure 2 shows a suite of positive curvature images initial to final stages for the 30-degree ramp.

    During the Previous HitexperimentsNext Hit we observed that curvature and fracture intensity qualitatively increased with time as initially hypothesized. Fractures initially accommodated the extensional displacement on the top of the anticline in individual segments; as the Previous HitexperimentsNext Hit progressed, the fracture segments began to connect and eventually generated faults to accommodate the increased displacement. At this point, fractures and curvature were no longer the principle features that accommodated displacement, and we stopped the Previous HitexperimentsNext Hit.

    Curvature increased over time with systematic deformation occurring in the extensional, 15-degree compressional ramp and 30-degree compressional ramp Previous HitexperimentsNext Hit. Deformation in the 45-degree compressional ramp was non-systematic, but followed a similar trend as that seen in the other two ramp Previous HitexperimentsNext Hit. Maximum curvature values varied based on the experimental setting, with the extensional value (7.5 x 10⁻³ cm-1) being one order of magnitude lower than the compressional settings (2.28 x 10⁻² cm-2 to 1.78 x 10⁻² cm-1).

    Calculated FI increased with curvature and correlations show a strong-positive linear relationship (Figure 3); however, fracturing did not occur at the same curvature value in each experiment. The extensional Previous HitexperimentsNext Hit showed fracturing initiation at a significantly lower curvature value (2.53 x 10⁻³ cm-1) than compressional Previous HitexperimentsNext Hit, where fracturing initiated at values one order of magnitude higher than extensional Previous HitexperimentsNext Hit. (2.13 x 10⁻² cm-1, 1.62 x 10⁻² cm-1, and 1.40 x 10⁻² cm-1 for 45-degree, 30-degree and 15-degree ramps, respectively).

    We interpret differences in horizontal strain as the main reason there is such a disparity in fracturing and curvature values at fracture initiation. In the extensional experiment, we assume that horizontal strain occurred throughout the experiment, since the basement plates were constantly moving apart - though we only measured vertical displacement. In the compressional settings, however, an anticline had to develop and grow before horizontal strain was great enough on its crest to induce fracturing.

    Conclusion

    The clay Previous HitmodelNext Hit experiment results suggest that curvature was the primary factor in fracture generation in controlled, laboratory settings. Assuming results from clay models show fracture patterns similar to real rocks, then clay-Previous HitmodelNext Hit results imply that curvature and fracture intensity follow a 3-phase curve of elastic deformation (no fractures), through linear correlation (Figure 3), to fracture saturation (movement along faults) when subsurface deformation involves basement reverse faulting or layer extension.

    In a future article we will show the correlation of curvature computed from 3-D seismic data to fractures seen in horizontal image logs.

    Acknowledgments

    We would like to thank AAPG member Ze’ev Reches from the University of Oklahoma for help with this project and guidance in clay Previous HitmodelTop setup and analysis. Additionally, we would like to thank Schlumberger for providing software for this research at the University of Oklahoma.

    Return to top.