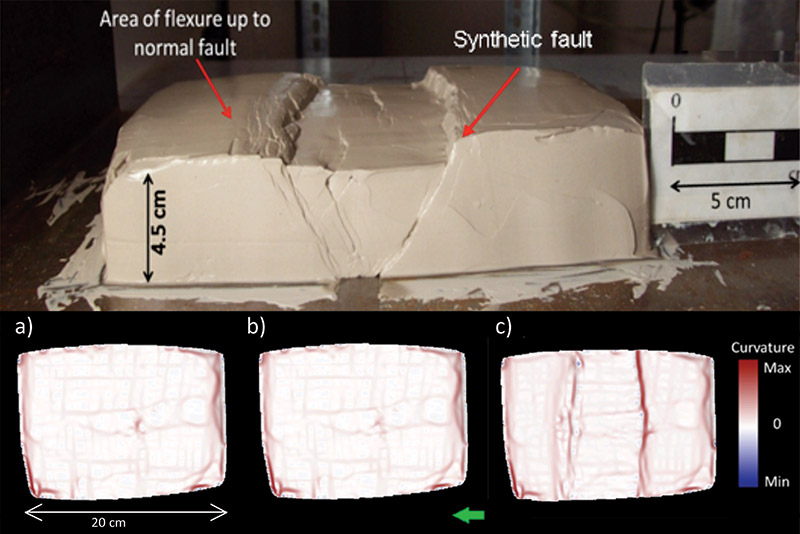
Figure 1. (Top) Side view of clay cake deformed during extensional experiment. (Bottom) Most-positive curvature computed from the undeformed to final stage of extension experiment a-c. Subtle curvature anomalies parallel and perpendicular to the fault correlate to tool marks made in the initial clay model construction. Fracture intensity calculations occurred on the left side of the central graben. The top of the model is to the left as indicated by the green arrow.