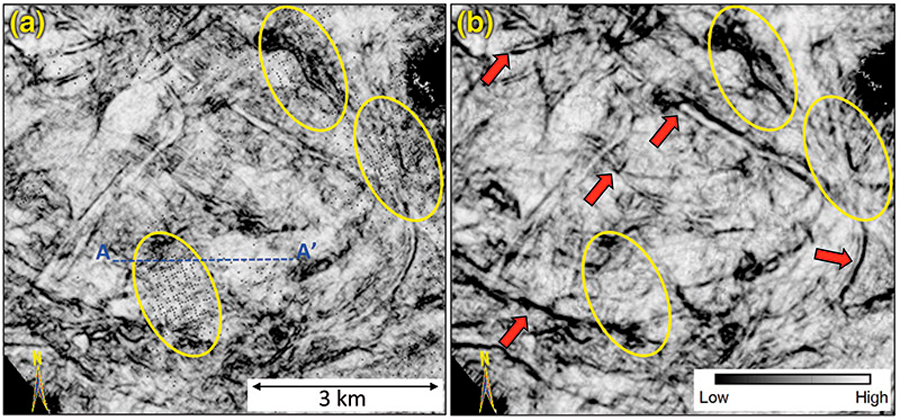
Figure 2. Horizon slices a few milliseconds above the marker indicated with the green arrow in Figure 1a, from the coherence volumes computed from seismic data (a) before, and (b) after 5-D interpolation.
Figure 2. Horizon slices a few milliseconds above the marker indicated with the green arrow in Figure 1a, from the coherence volumes computed from seismic data (a) before, and (b) after 5-D interpolation.