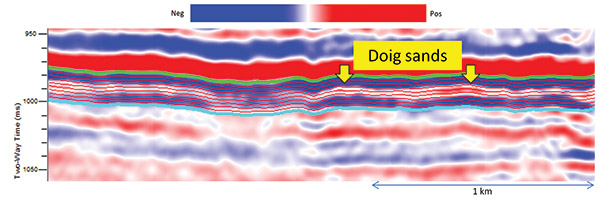
Figure 1. A segment of a seismic section shows the signature of the Doig sandstone as high positive amplitudes. To isolate the sand zone the upper horizon is picked, which looks quite smooth. The lower horizon, peak, trough or zero crossing if picked, however, looks quite haphazard and does not yield a consistent slab of waveform data that could be used to run waveform classification. The upper horizon is used to generate the lower horizon by adding 24 ms to it. The interval between the two horizons is divided into 10 parallel horizons.