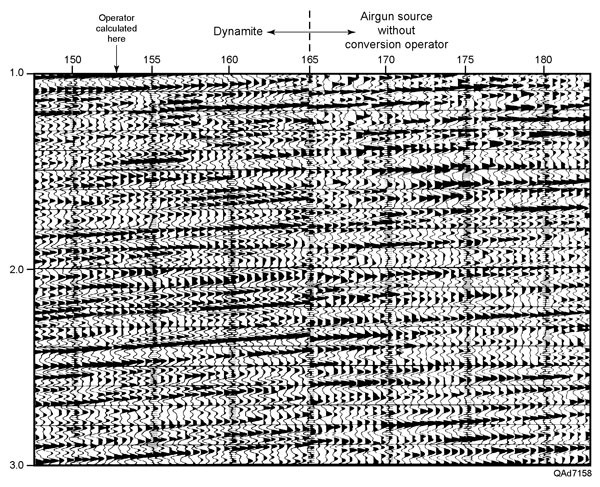
Figure 1. This shallow-water profile was recorded with two different sources – shot-hole explosives and air guns. A portion of the image produced by shot-hole explosives is shown to the left of station 165; a portion of the image produced from the air-gun data is shown to the right. The interpreter preferred the data generated by the shot-hole explosives. Cross-equalization operators that converted the phase and frequency spectra of the air-gun data to the phase and frequency spectra of the shot-hole data were calculated at station 153.