![]() Click to view presentation in PDF format.
Click to view presentation in PDF format.
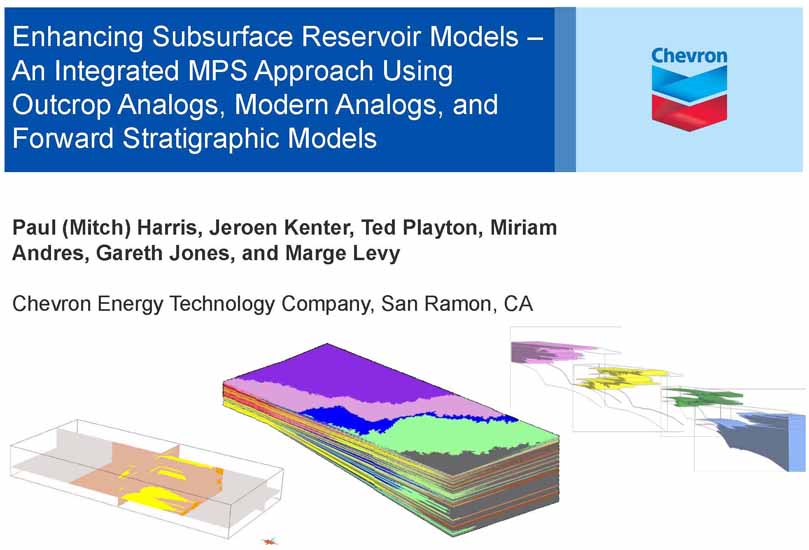
Enhancing Subsurface Reservoir Models – An Integrated MPS Approach Using Outcrop Analogs, Modern Analogs, and Forward Stratigraphic Models*
Paul (Mitch) Harris1, Jeroen Kenter1, Ted Playton1, Miriam Andres1, Gareth Jones1, and Marge Levy1
Search and Discovery Article #50418 (2011)
Posted May 31, 2011
*Adapted from oral presentation at AAPG Annual Convention and Exhibition, Houston, Texas, USA, April 10-13, 2011. Please refer to closely related article by Mitch Harris and co-workers, entitled "Analyzing Spatial Patterns in Modern Carbonate Sand Bodies from Great Bahama Bank," Search and Discovery Article #50419 (2011).
1Chevron Energy Technology Company, San Ramon, CA ([email protected])
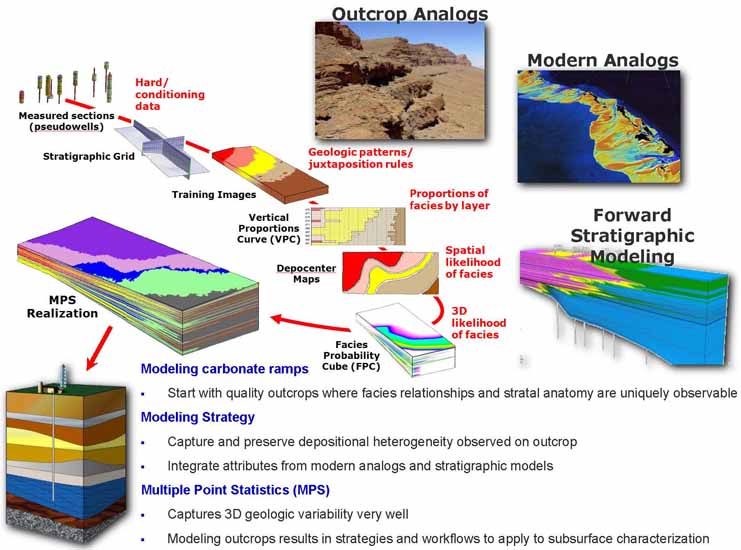
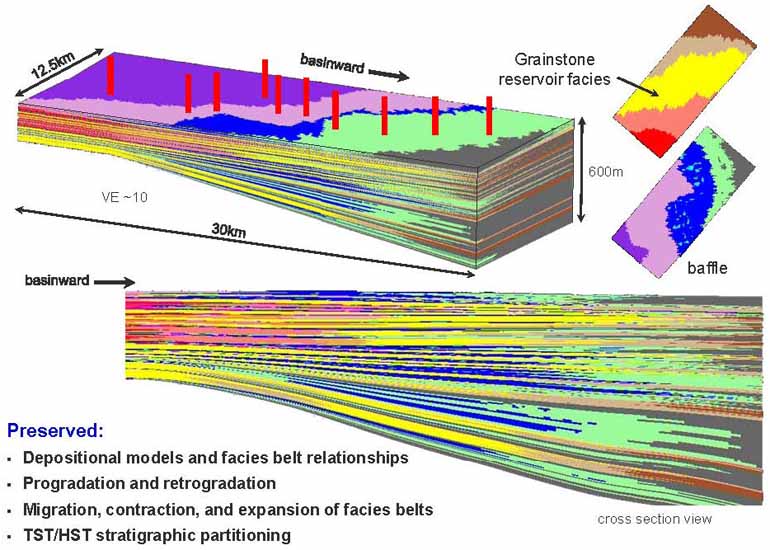
The Multiple Point Statistics (MPS) approach to reservoir modeling uses combinations of hard data constraints (well and seismic data) and geologic concepts (e.g., depositional models) to populate 3D grid space. Using a carbonate ramp example we combine information from outcrop and modern analogs with Forward Stratigraphic Modeling (FSM) to suggest strategies that can be incorporated into subsurface modeling workflows. Using this integrated approach, a ramp outcrop is successfully simulated wherein the sequence stratigraphic architecture, including stratigraphic partitioning of facies belts, ramp progradation and retrogradation, and changes in facies belt width are captured.
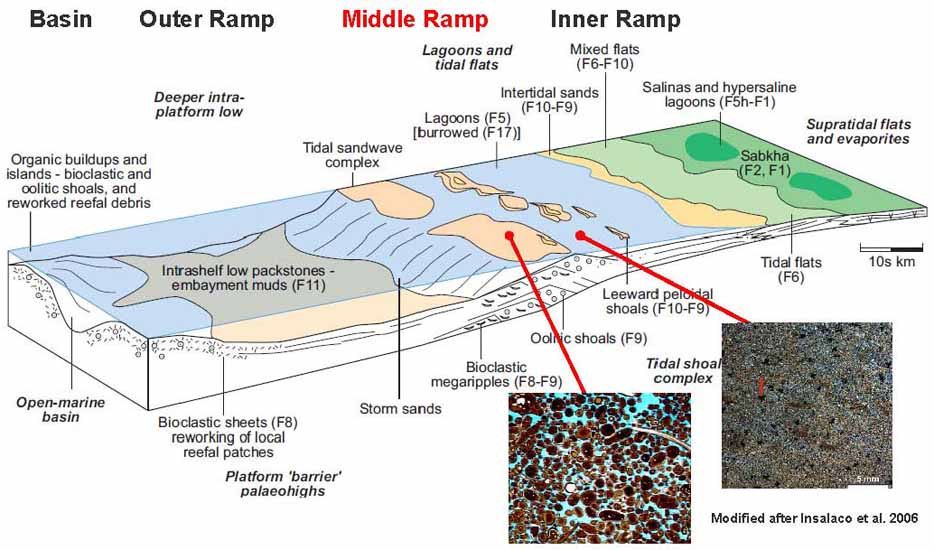
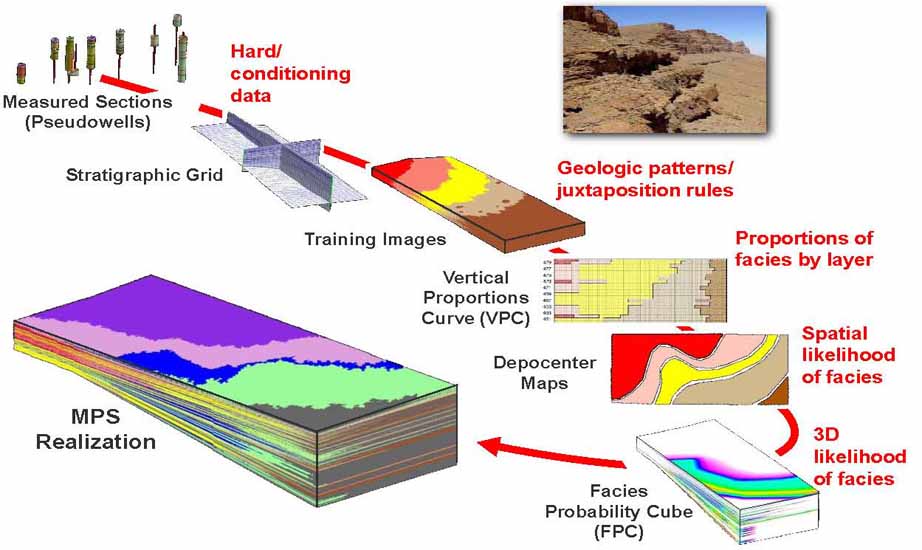
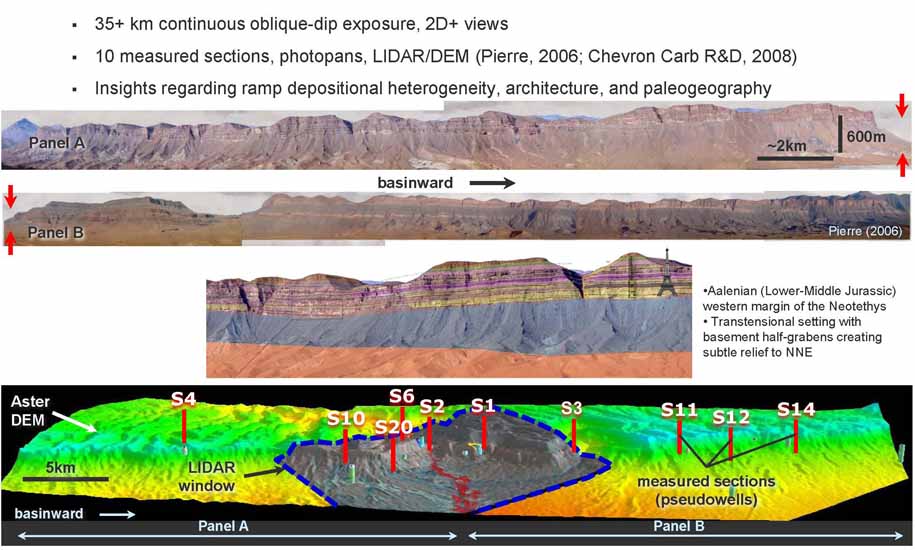
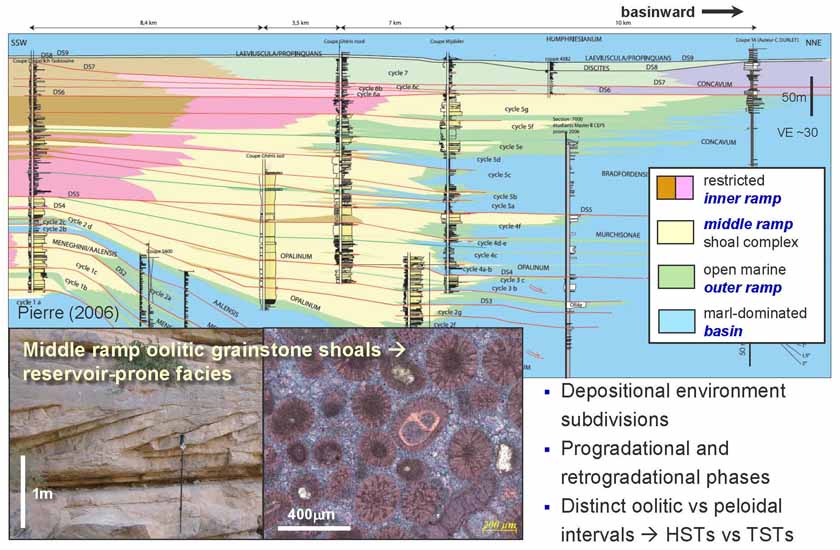
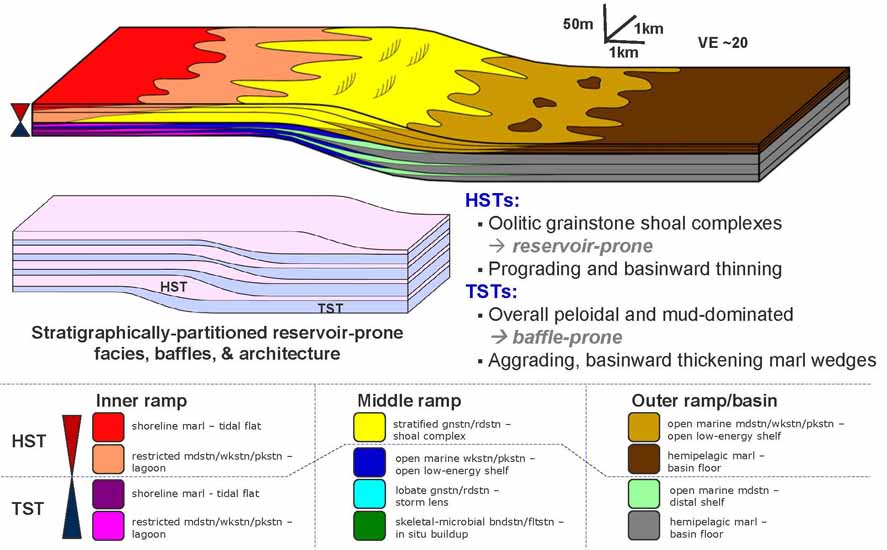
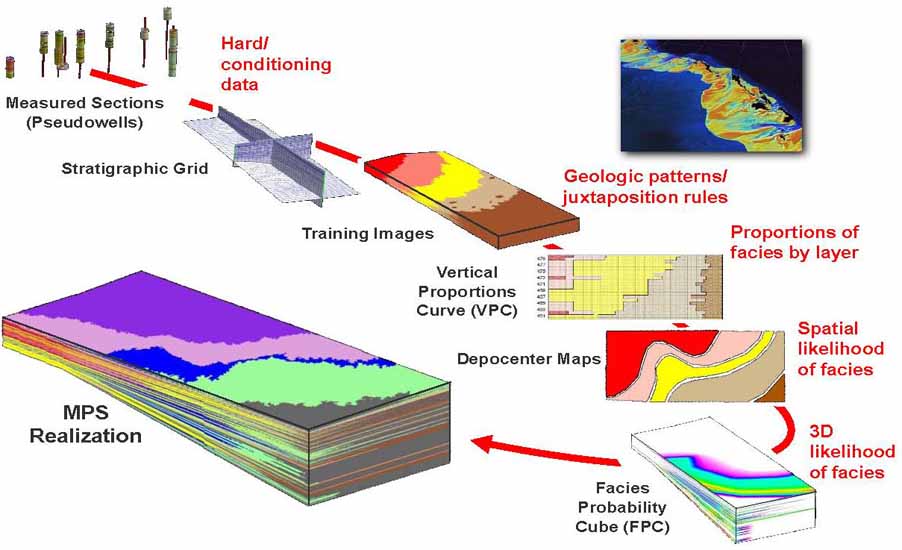
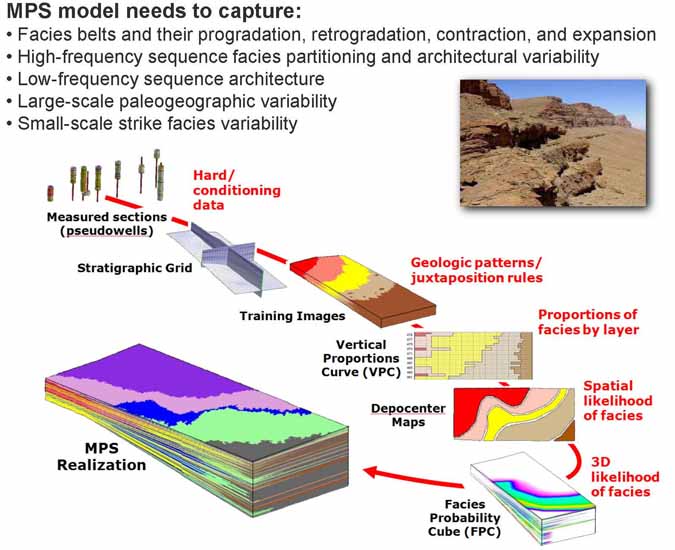
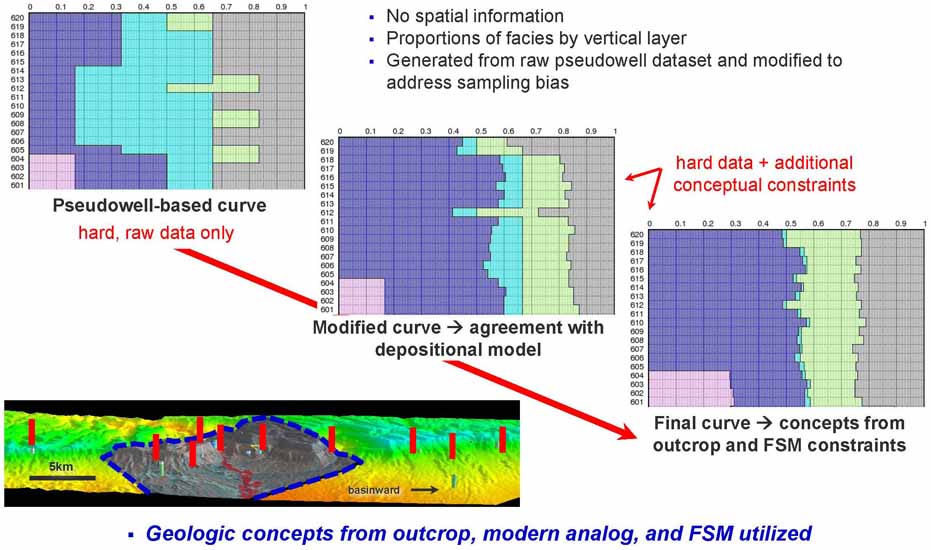
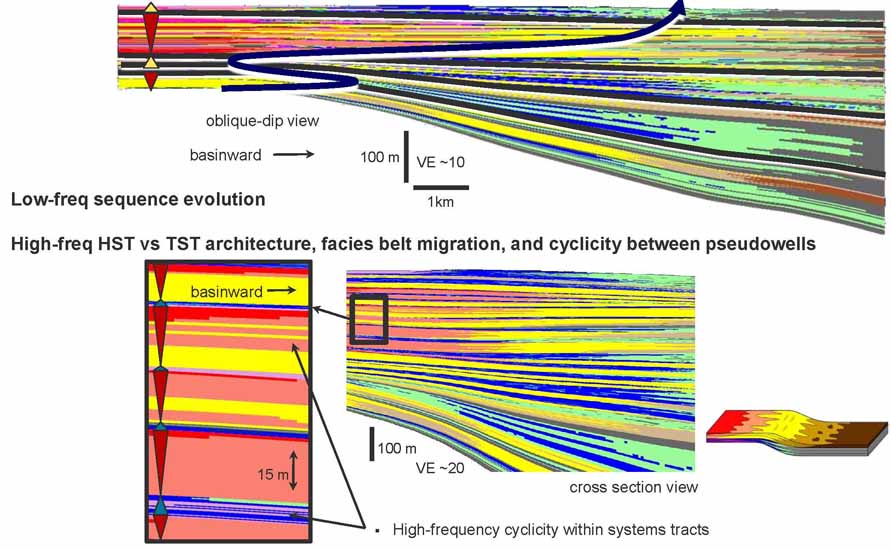
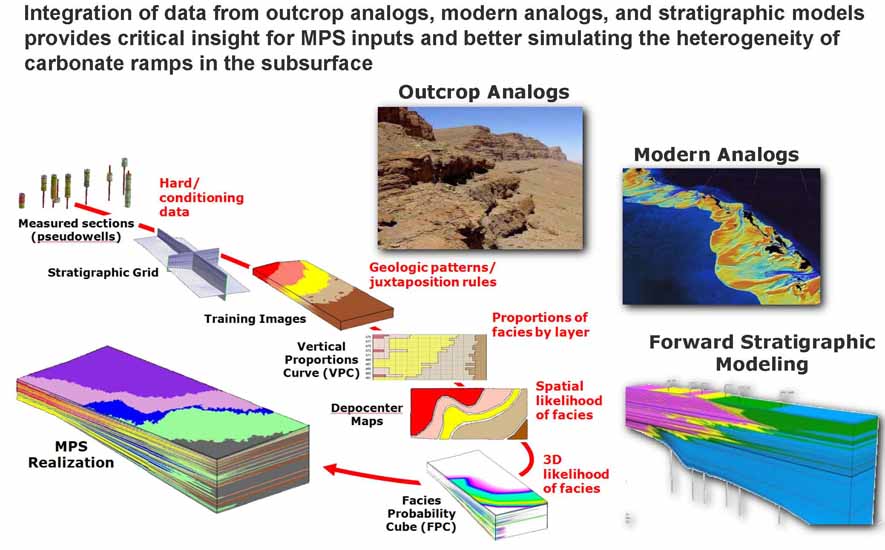
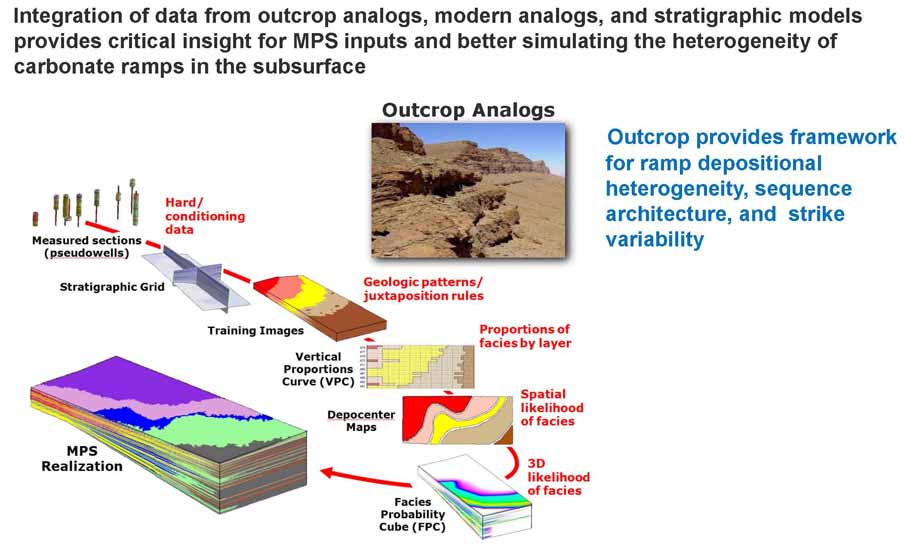
LIDAR and GPS data are integral for an MPS outcrop model to capture the stratigraphic framework and representation of complex stratal patterns, including: (1) environments of deposition (EODs) - inner, middle, and outer ramp; (2) lower frequency sequence architecture showing two cycles of aggradation to progradation; and (3) high frequency sequences displaying partitioning wherein HSTs are progradational, oolitic grainstones and TSTs are retrogradational to aggradational, peloidal mud-dominated wedges. Concepts from the outcrop are used in virtually every step of the MPS workflow, including Training Images, the Vertical Proportions Curve (VPC), and a Facies Probability Cube (FPC), which together capture juxtaposition relationships and 3D likelihoods of occurrence of ramp environments.
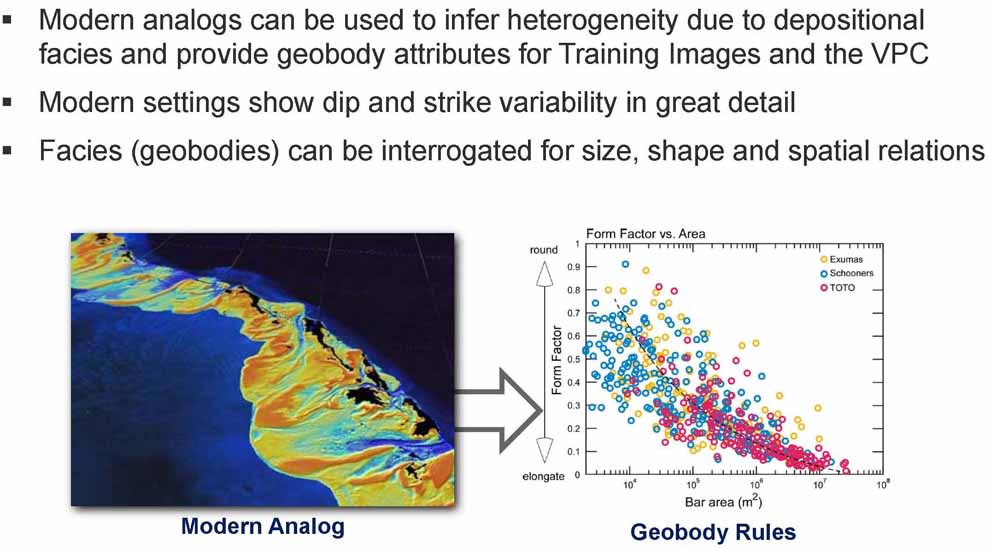
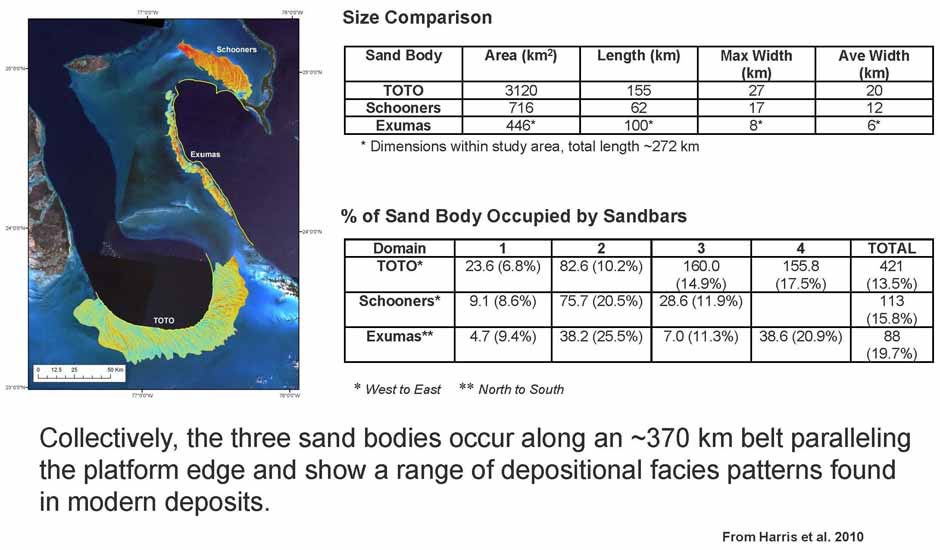
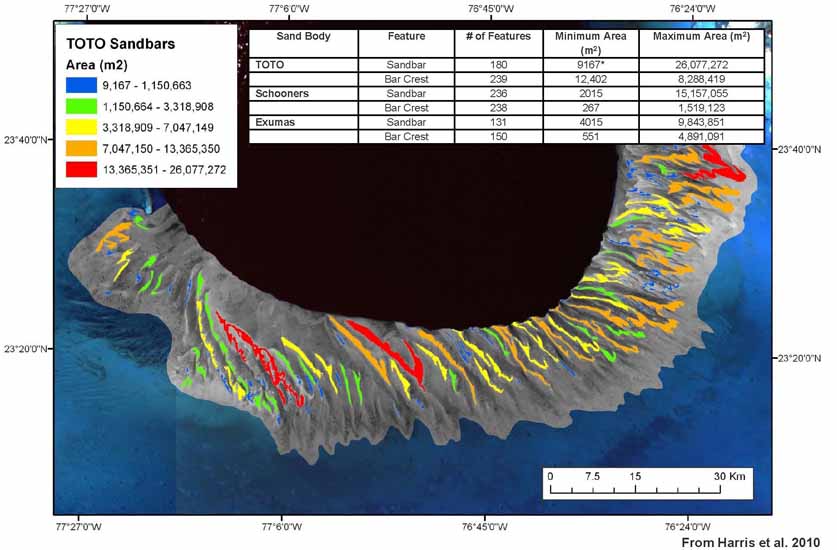
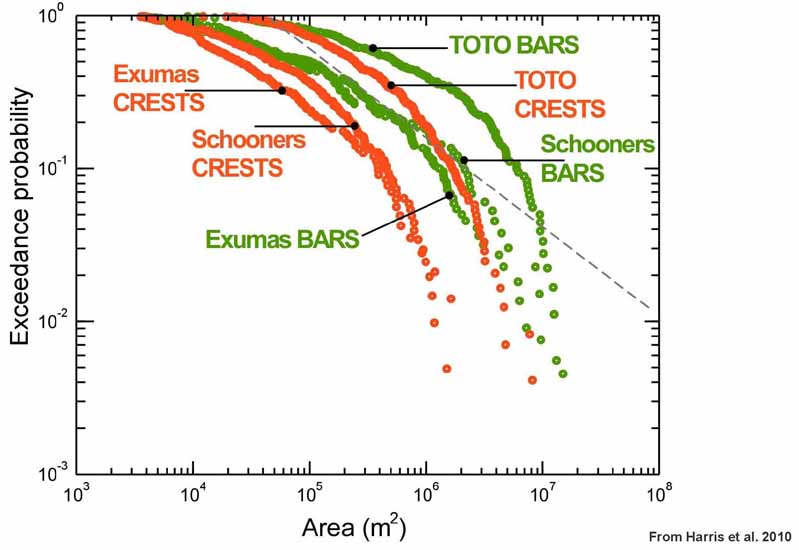
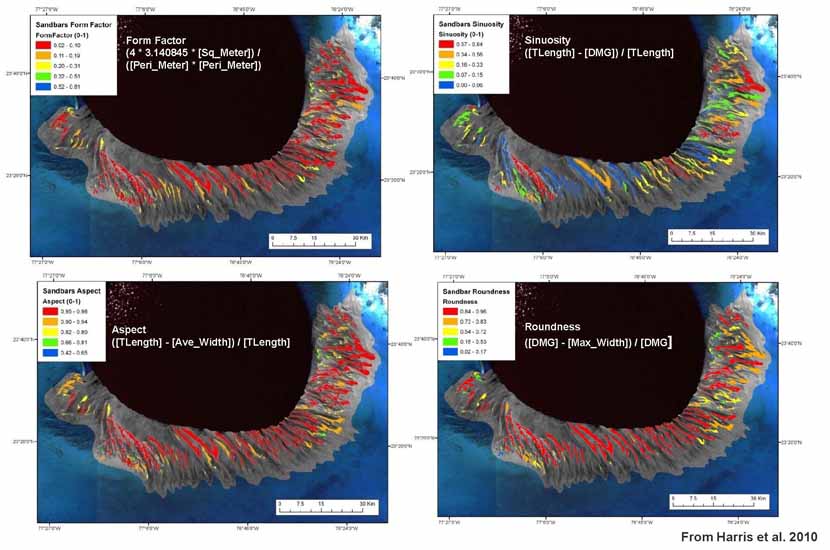
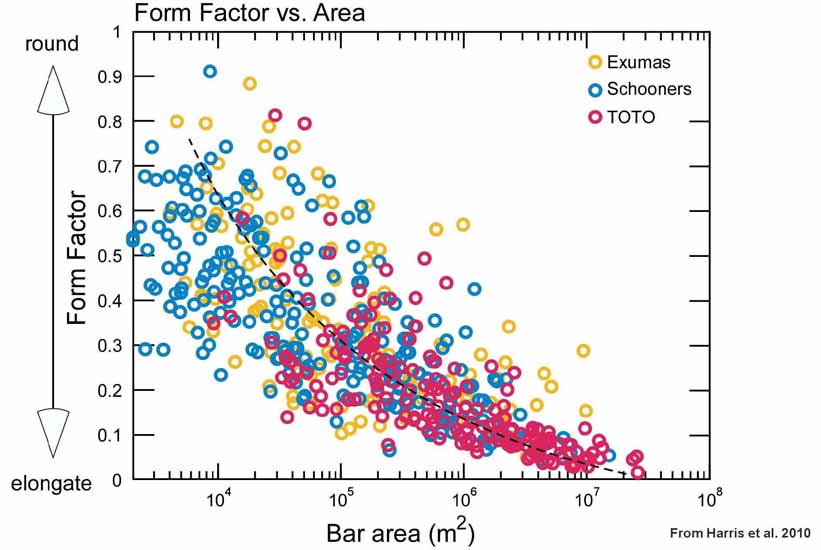
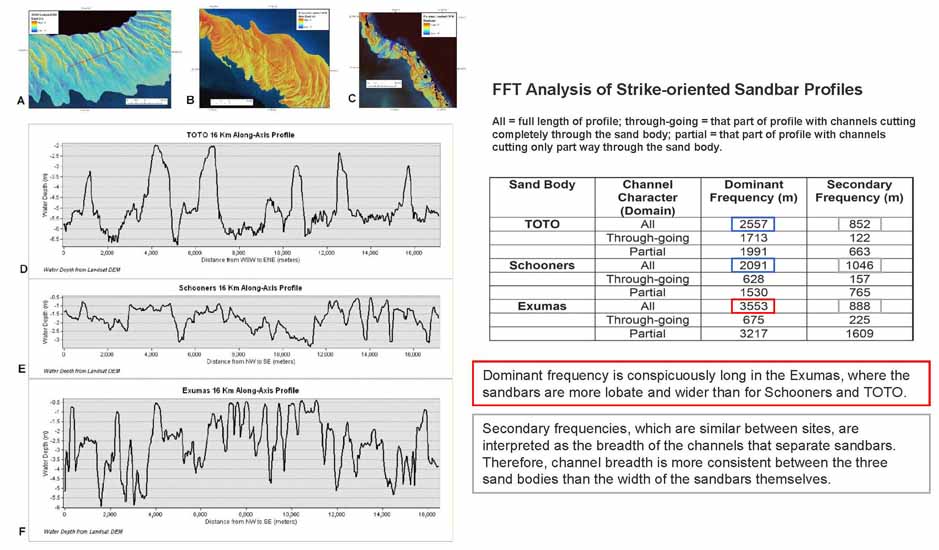
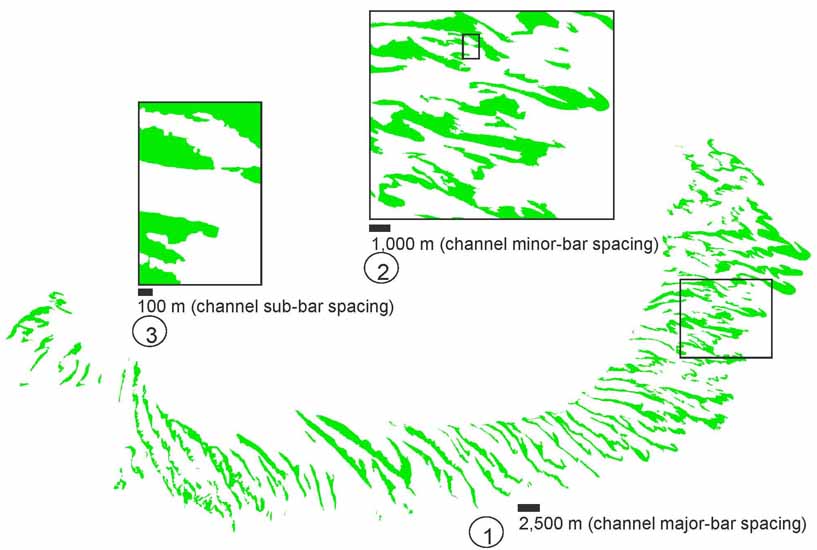
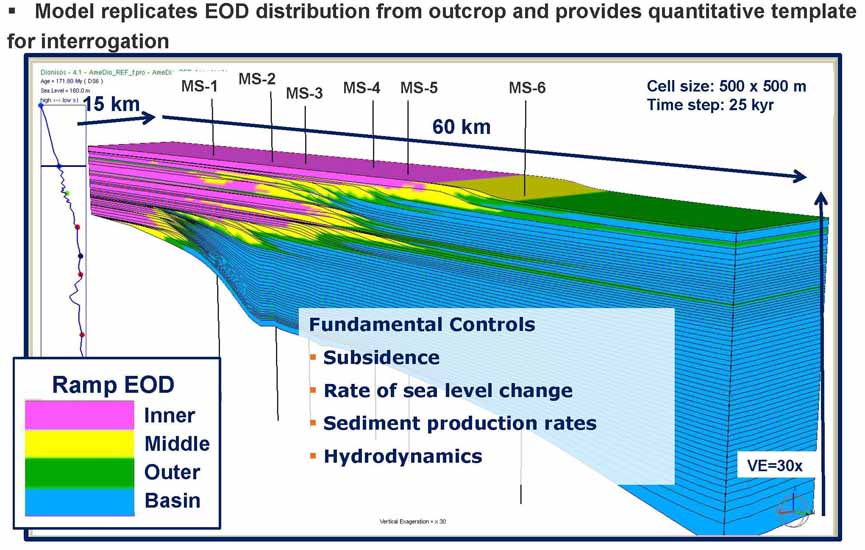
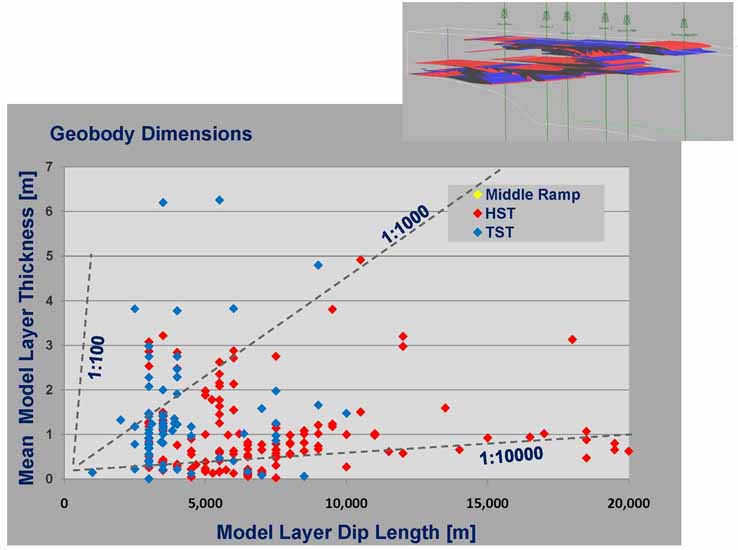
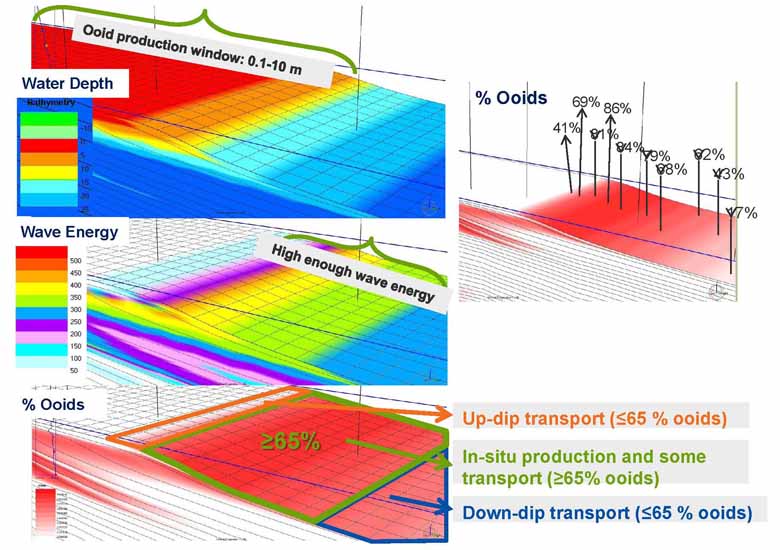
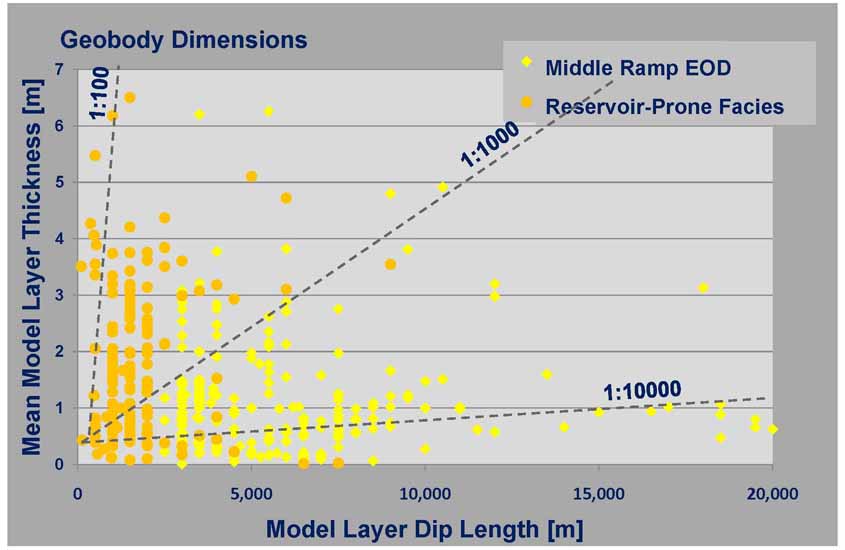
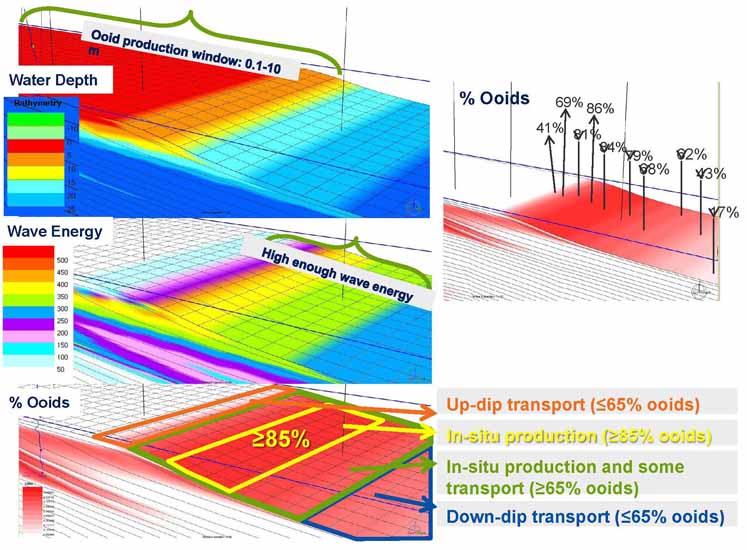
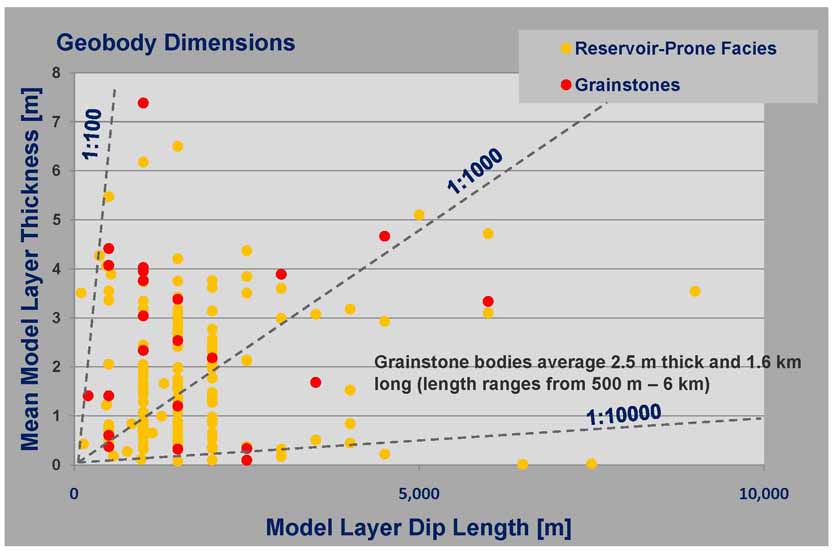
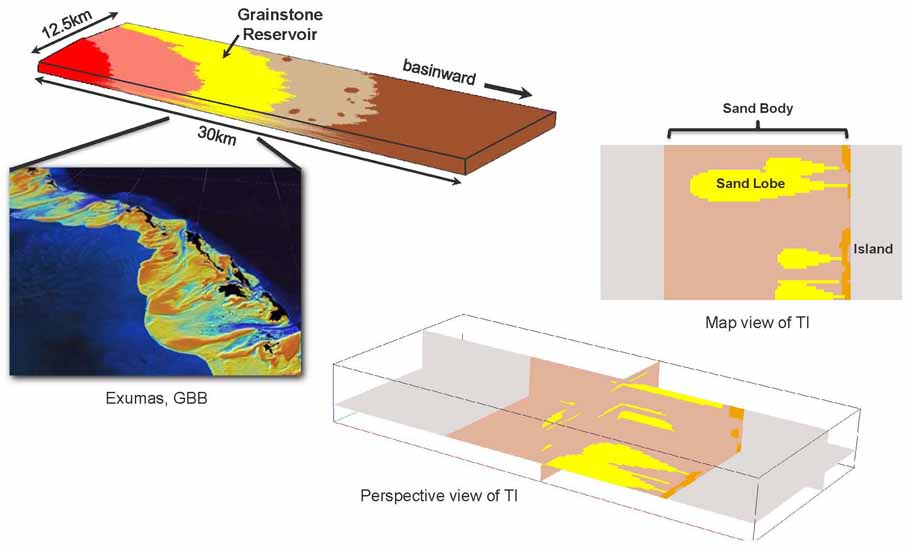
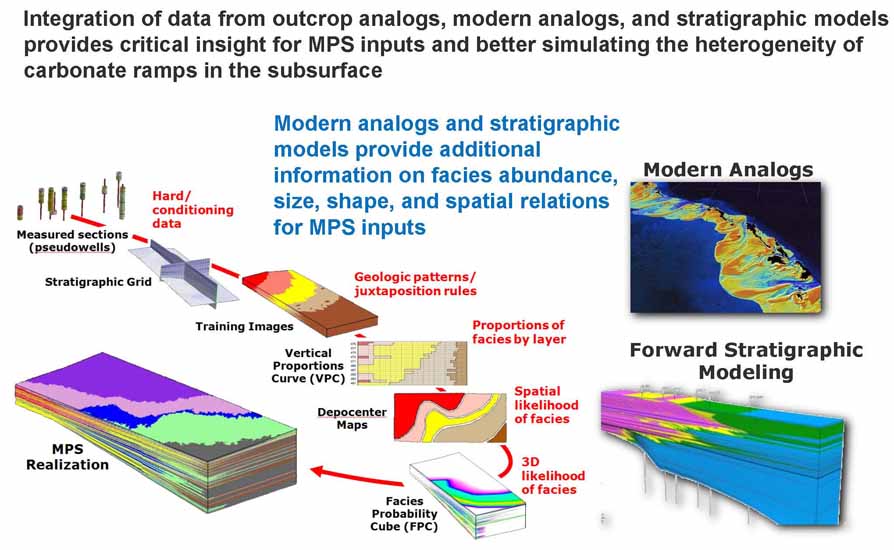
Modern carbonate analogs provide geobody attributes for Training Images and the VPC, including widths of facies belts, configuration of facies patterns, and variation along strike. Flood tidal deltas in the Exumas of Great Bahama Bank occur within a >450 km2 linear belt with: a) delta lobes extending up to 8 km, averaging 6 km, onto the platform; b) large deposits being highly sinuous, more irregular in shape than smaller ones, and maintaining connectivity; and c) tidal channels averaging ~3 km in length with regular, but regionally variable, spacing. FSM provides conceptual attributes for Training Images and constraints on the VPC in terms of global proportions, and in this case a ‘Dionisos’ model simulates the outcrop and provides a quantitative template for interrogating the extent and distribution of potential reservoir and non-reservoir facies providing insight into dip length, thickness, and connectivity of the middle ramp EOD, HST and TST components, reservoir-prone and best reservoir facies.
|
|
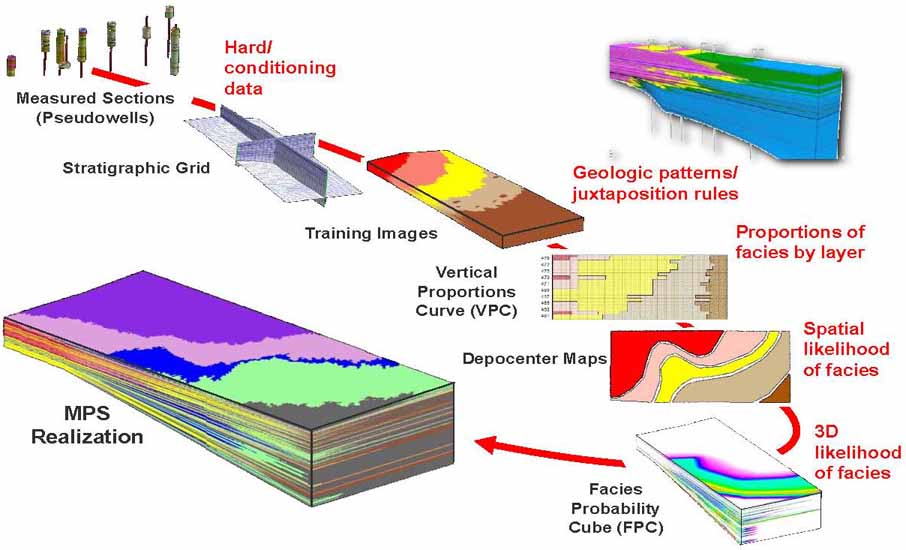
Integrated Reservoir Characterization and Modeling of Ramp Environments of Deposition (EOD’s) Modeling Workflow Using Multiple Point Statistics (MPS) (Figures 2 and 4)
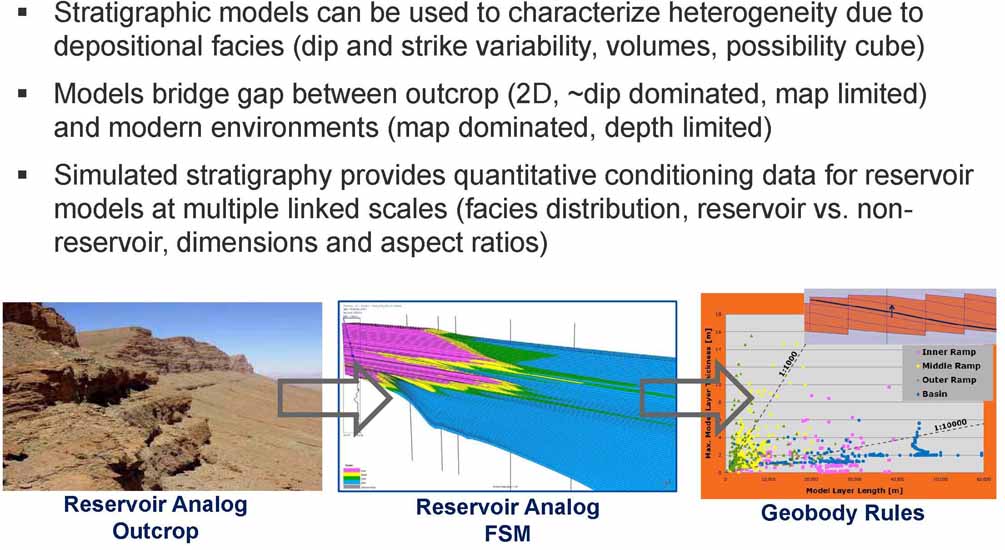
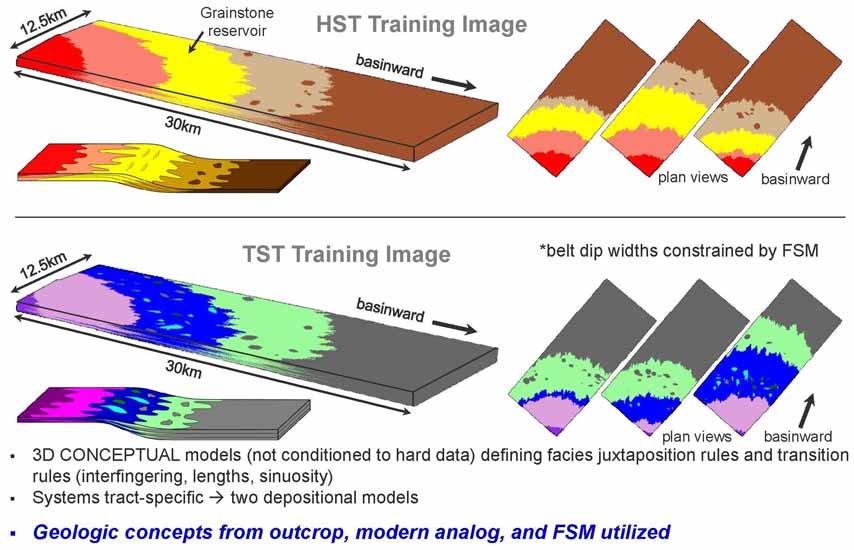
Outcrop Analogs (Figures 4, 5, 6, and 7) Modern Analogs (Figures 8, 9, 10, 11, 12, 13, 14, 15, and 16) Forward Stratigraphic Modeling (FSM) (Figure 17)
Value of Stratigraphic Modeling (Figure 18)
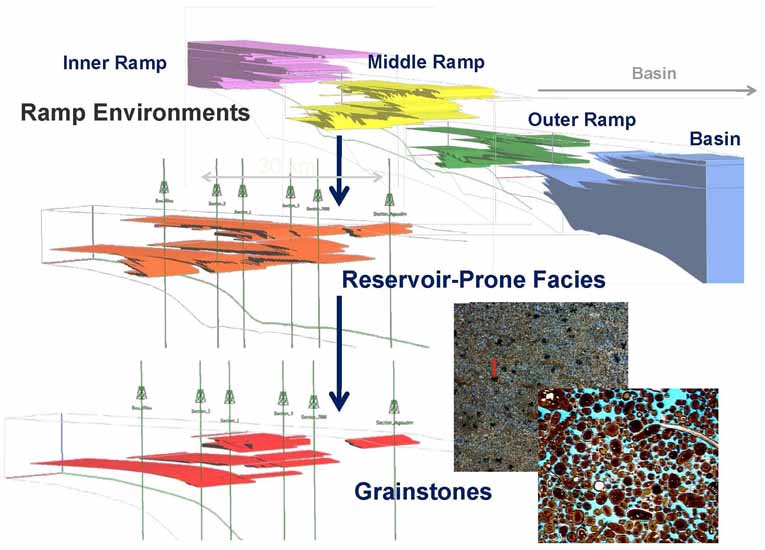
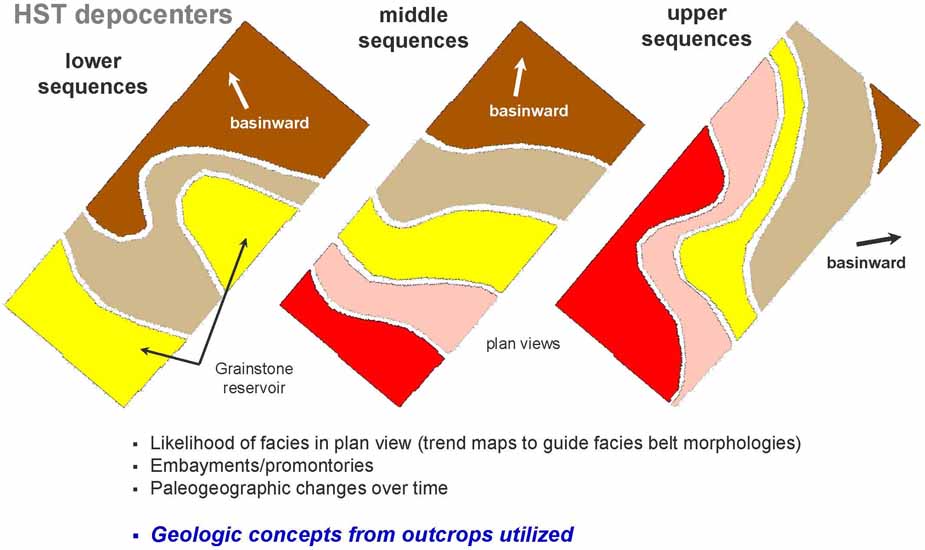
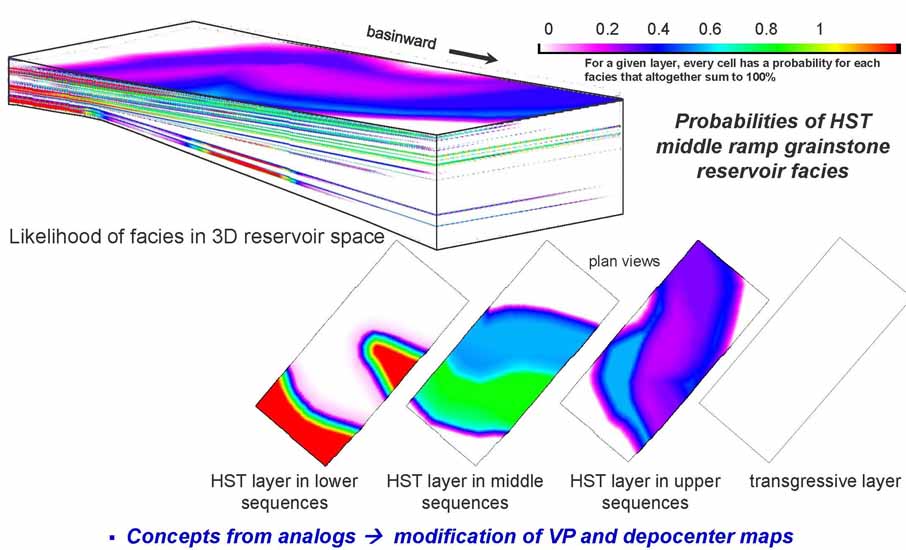
Based on Outcrop (Figure 19) Ramp Heterogeneity (Figure 20) Middle Ramp EOD (Figures 21, 22, 23, 24, and 25) Integrated MPS Model (Figure 26)
Training Images (Figures 27 and 28) Vertical Proportions Curve (Figure 29) Maps (Figure 30) Facies Probability Cube (Figure 31) Simulations (Figures 32 and 33)
Integration of data from outcrop analogs, modern analogs, and stratigraphic models provides critical insight for MPS inputs and better simulating the heterogeneity of carbonate ramps in the subsurface. Outcrop provides framework for ramp depositional heterogeneity, sequence architecture, and strike variability. Modern analogs and stratigraphic models provide additional information on facies abundance, size, shape, and spatial relations for MPS inputs. Harris, P.M., and J. Ellis, 2010, Depositional Facies Patterns and Resultant Heterogeneity in Carbonate Sand Reservoirs – Insight from Modern Analogs: Search and Discovery Article #50324, Web accessed 25 May 2011, http://www.searchanddiscovery.com/documents/2010/50324harris/index.htm. Insalaco, E., A. Virgone, B. Courme, J. Gaillot, M. Kamali, A. Moallemi, M. Lotfpour and S. Monibi, 2006. Upper Dalan Member and Kangan Formation between the Zagros Mountains and offshore Fars, Iran: Depositional system, biostratigraphy and stratigraphic architecture. GeoArabia, v. 11/2, p. 75-176. Pierre, A., 2006, A reference example for Oolitic ramp systems: A 37 km long continuous outcrop (Jurassic Cliffs of Amellago, High Atlas, Morocco): Ph D. thesis Université de Bourgogne, Dijon, France, 223 p.
Copyright © AAPG. Serial rights given by author. For all other rights contact author directly. |
 Abstract