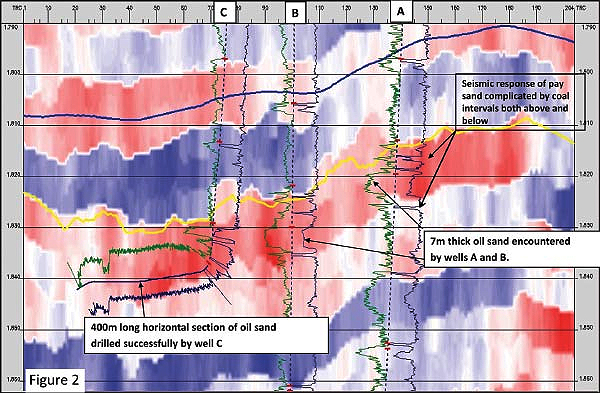
Figure 2. A relative impedance profile calculated from thin-bed reflectivity derived from input seismic data. The log curves are sonic data (right) and gamma-ray measurements (left) at each well. Wells A and B encountered a seven-meter oil sand as indicated, but the seismic signature is complicated because of thin coal units above and below the sand. The relative acoustic impedance exhibits a pale reddish color for the oil sand and allows the sand to be tracked to the left of the profile. Horizontal well C was drilled based on this interpretation, and the horizontal section of this well penetrated approximately 400 meters of productive sand.