--> Comparison of P-wave data (a) and SH data (b) acquired along a profile that traverses a low-velocity Earth surface on the right and a high-velocity surface on the left. The SH data image beneath the exposed carbonate; the P-wave data do not. (From Fix et al., 1986).

Datapages, Inc.Print this page


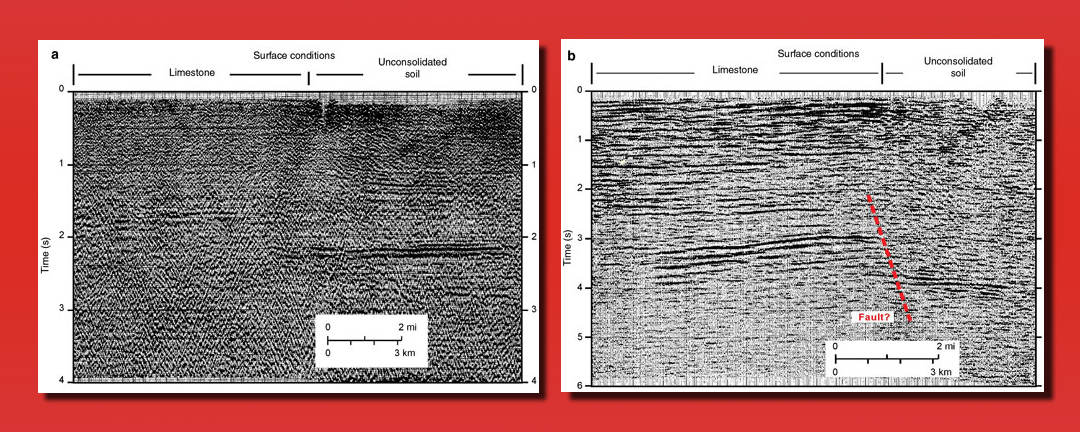
Figure 4. Comparison of P-wave data (a) and SH data (b) acquired along a profile that traverses a low-velocity Earth surface on the right and a high-velocity surface on the left. The SH data image beneath the exposed carbonate; the P-wave data do not. (From Fix et al., 1986).