Click on line XL57 or A to view Figure 2.
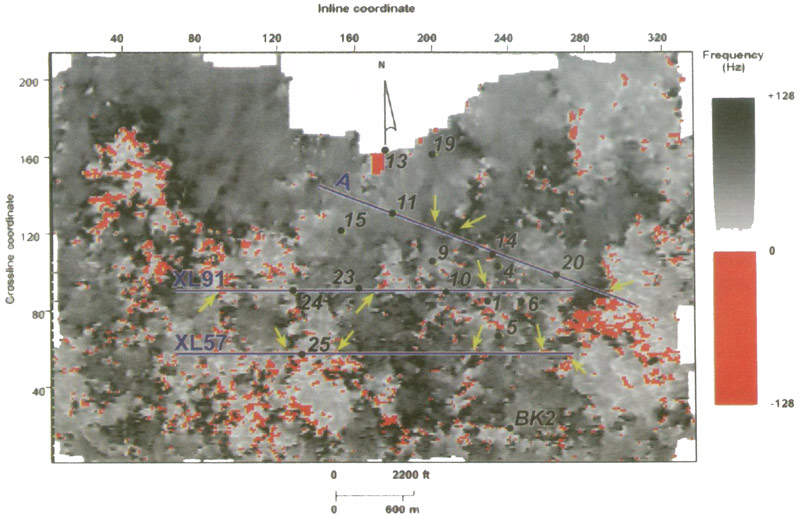
Figure 1. Map of instantaneous frequency behavior across a thin-bed turbidite system. Negative frequencies (red) and frequencies greater than Nyquist (darkest black) are impossible frequency values but are commonly created by software that generates instantaneous seismic attributes. Arrows show where three arbitrary profiles intersect trends of impossible frequencies.