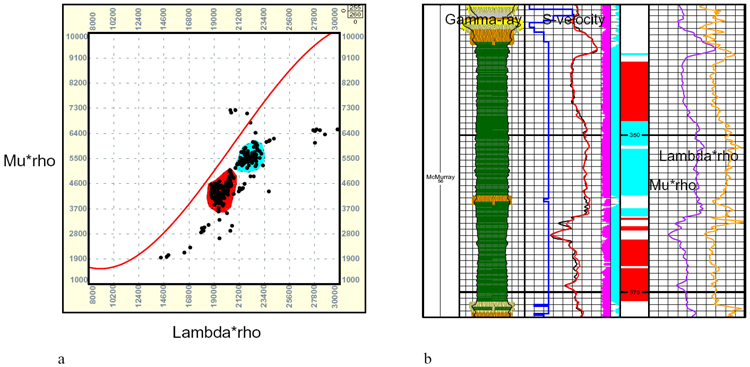
Figure 5. a) Crossplot showing lambda*rho, mu*rho points from well 7-16 with shale clusters highlighted. b) Log display showing crossplot polygons highlighted in depth.
Figure 5. a) Crossplot showing lambda*rho, mu*rho points from well 7-16 with shale clusters highlighted. b) Log display showing crossplot polygons highlighted in depth.