Click image to view enlargement.
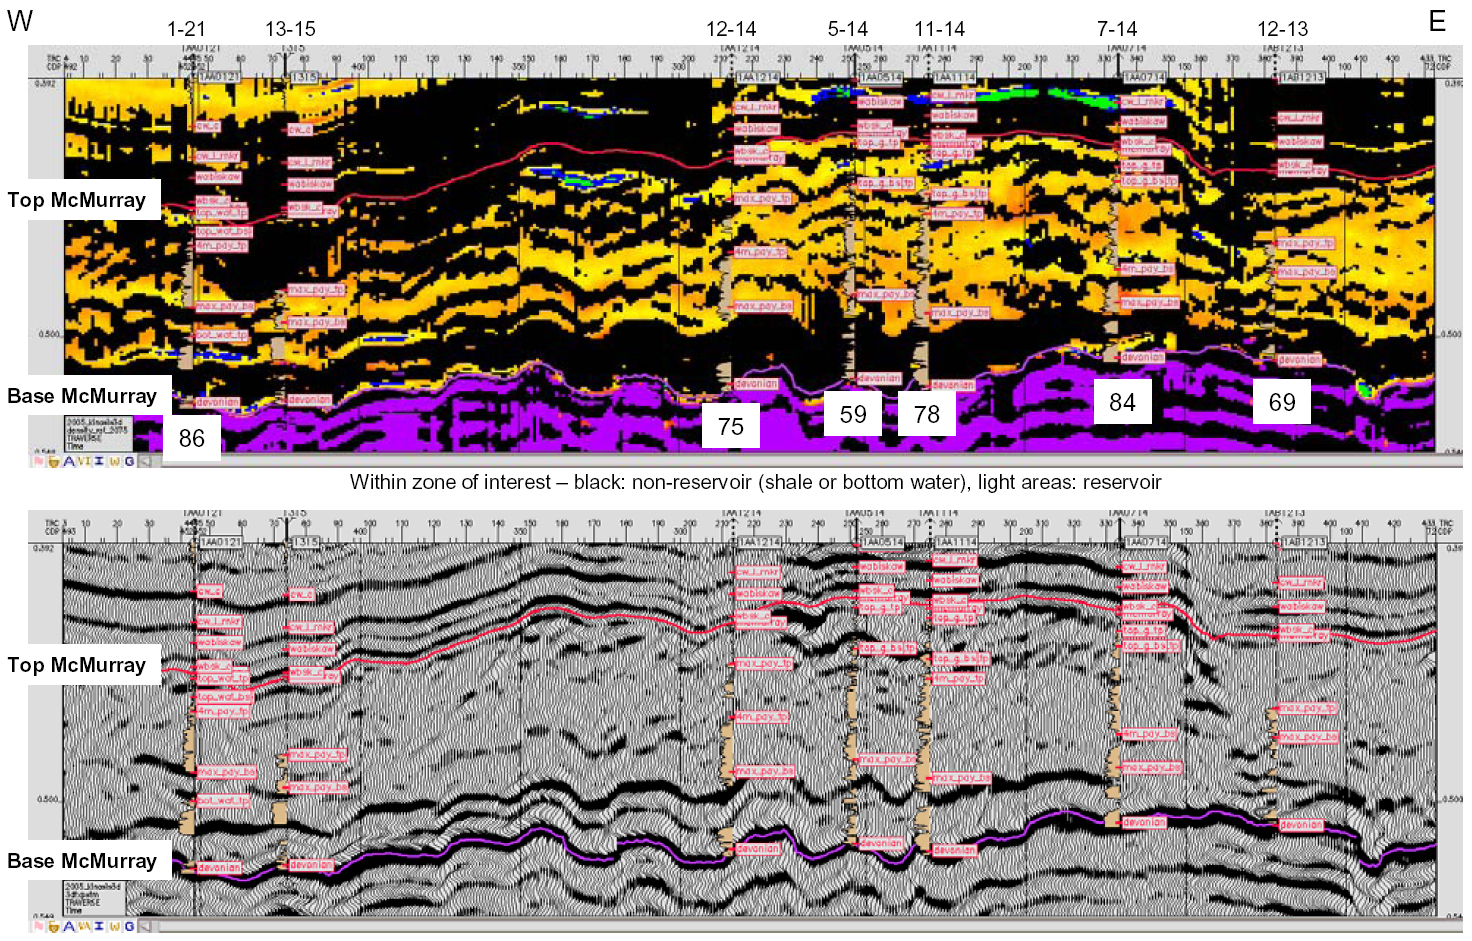
Figure 3. Comparison of conventional seismic profile (bottom) with derived facies profile (top). Black represents non-reservoir (shale or bottom water), light areas are bitumen reservoir. Gamma ray logs with 0 to 70 (at baseline) api range are displayed on the profiles. 13-15 was the only well on this profile used in the derivation of facies shown above; the rest were drilled after the facies volume was completed. The numbers shown below the well bores are the percentage match on a meter-by-meter basis of the predicted facies from seismic with the actual facies from logs within the zone of interest.