Click on image to view enlargement.
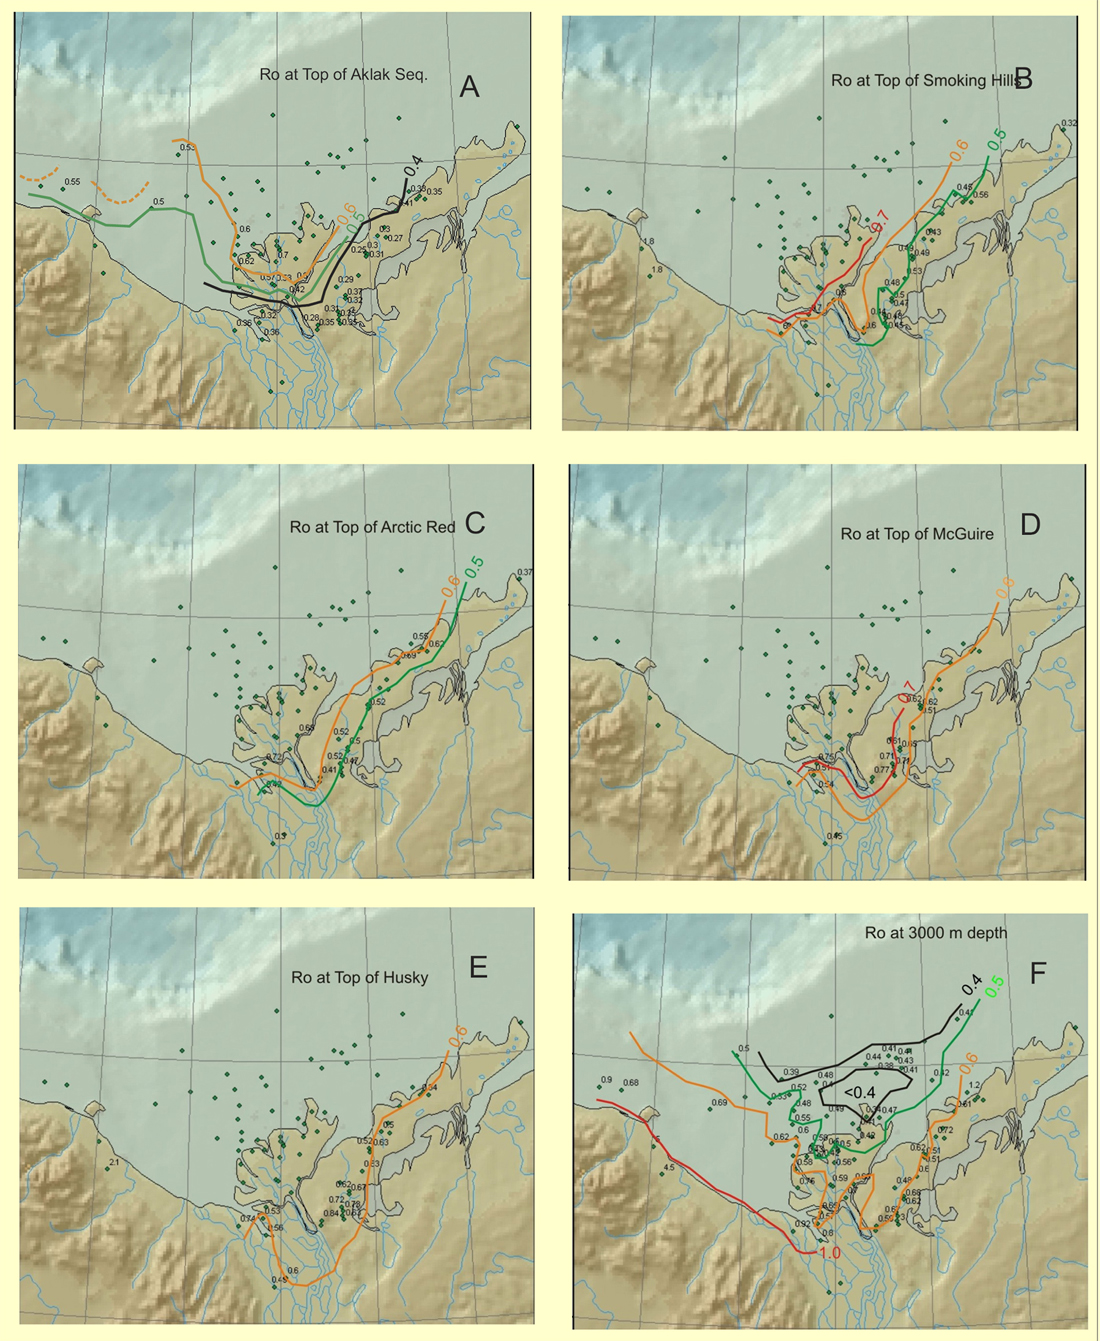
Figure 5. Spatial variation of maturity levels from five inferred source rocks in the basin (Figure5 a - e) as well as the basin thermal regime indicated by contours of the measured vitrinite reflectance at a depth of 3000m below KB (Figure 5 f). The green dots are well locations with Ro data and the values are the Ro values at the top of the five potential source rock intervals or at a depth of 3000 meters below KB.
Click to view in sequence maturity levels, from younger to older source rocks.