 Click to view poster in PDF format.
PSShale Gas Reservoir Systems: Insights from North of the Border*
By
Daniel John Kerridge Ross1 and R. Marc Bustin1
Search and Discovery Article #10129 (2007)
Posted July 25, 2007
*Adapted from poster presentation at AAPG Annual Convention, Long Beach, California, April 1-4, 2007.
Permission of the authors is required for copying or downloading this article or any part of it.
1University of British Columbia, Vancouver, BC ( [email protected] )
Organic-rich Devonian and Jurassic strata are considered to be excellent candidates for gas shales in Western Canada. These strata have TOC contents ranging between 1-40 wt%, thermal maturities into the dry-gas window, and thicknesses in places over 1700 m. The ratio of total organic carbon (TOC) to gas sorption varies markedly from unit to unit depending on pore-structure, thermal maturation, moisture and inorganic composition. For low maturity shales, surface areas and micropore volumes are low, ranging from 0.23-0.64 cc/100g CO2 monolayer volume despite TOC values up to 38 wt%. The increased sorption of methane with increasing TOC, independent of microporosity and surface area, implies gas is primarily stored through solution in the bituminite fraction. Thermally mature shales have greater micropore volumes (0.3-1.2 cc/100g) associated with the organics, resulting in more gas adsorbed per wt% TOC. Structural transformation of the bituminite during maturation-induced diagenesis plays a key role in the creation of adsorption sites.
The inorganic component is also important to gas capacities. Carbonate-rich samples often have lower organic carbon contents and porosity hence potentially lower sorbed and free-gas capacities. Highly mature Devonian shales are both silica and TOC-rich (up to 85% quartz and 5 wt% TOC) and as such, deemed excellent potential shale gas reservoirs because they are both brittle (fracable) and have high sorbed gas capacities. However the lower porosity of silica-rich mudrocks implies potential frac-zones may not provide optimum gas capacities.
|
|
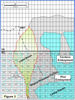
As the exploration frontier of shale gas systems expands to new regions, analogous reservoirs from the United States are continuously being sought to improve exploration strategies in Western Canada. The Western Canadian Sedimentary Basin (WCSB) contains vast thicknesses of fine-grained, organic-rich siliciclastic material (>80% of total strata; Figure 1) and has estimated shale gas resources over 1000 tcf (Bustin, 2005). With the development of shale gas research in North America, it is apparent that the heterogeneity of shales and mudrocks questions the applicability of reservoir analogues - heterogeneity which transcends to the nanometer pore-size scale (Ross and Bustin, in prep). To reduce exploration risk and accurately determine gas capacities, an understanding of gas-storage mechanisms is required so that producible reserves can be quantified. The research presented here sets out to elucidate the potential controls on gas capacities using examples from Jurassic and Devonian-Mississippian (D-M) strata in British Columbia (BC), Canada (Figure 2).
The Jurassic and Devonian strata in northern BC consists of shales, mudrocks, marlstones and carbonates (Pelzer, 1966; Ross and Bustin, in press). Organic-rich sediments of the Gordondale (Jurassic) and Muskwa/Besa River (D-M) were deposited to the west of a carbonate platform (Figure 3) under variably dysoxic-anoxic bottom waters (Ross and Bustin, in press; Ross and Bustin, in prep). In the Peace River district (Jurassic study area), the Gordondale Member attains thicknesses of 25-30 m with TOC contents between 0.8 and 40 wt% (Ross and Bustin, in press). Prospective D-M shale gas exploration targets range in thickness from 30 m to over 1000m in the Liard Basin (Figure 3). The Liard Basin itself is a sub-basin of the WCSB (Gabrielse, 1967) and contains up to 5000 m (16,400 ft) of Paleozoic and Mesozoic sedimentary fill (Walsh et al., 2005), covering an area of 25,000 km (9600 mi). D-M sediments have TOC contents ranging between 0.9 and 5.7 wt%.
Jurassic and D-M shales have sorbed gas capacities which correlate with TOC although the correlation is significantly weaker for Jurassic samples (Figure 4), underlining the sorption affinity of the organic matter of the organic matter (samples analyzed at 30C). The organic fraction is dominated by monomaceral assemblages of micrinite (D-M) and matrix bituminite (Jurassic, after Teichmüller, 1986). Sorbed gas capacities range from 0.1 cc/g for organic-lean shales to 2 cc/g for organic-rich shales. As evident from Figure 4, the ratio of gas sorption to TOC is larger for D-M shales than Jurassic shales. With approximately 5 wt% TOC, D-M sediments sorb 1.5 cc/g in contrast to Jurassic shales which require 10 wt% TOC to sorb similar methane concentrations. Therefore factors other than TOC volume are influencing gas sorption (such as maturity; see Section 5).
Low pressure CO2 analyses of D-M shales show microporosity increasing with TOC and sorption capacity (Figure 5), highlighting the greater overlapping potential energy of pore walls in smaller pores (Burggraaf, 1999). Jurassic shales are organically-richer than D-M samples but do not have an associated increase in surface area with TOC. The ratio of micropore surface area to TOC is lower for Jurassic shales, averaging 4.2 compared to 8.6 for D-M shales (Table 1). Thus despite the relative importance of organic carbon to sorption capacity (as illustrated by Figure 4), the influence of TOC on micropore structure is not as apparent in Jurassic samples. In these cases, matrix bituminite, which is the dominant organic matter type in the Jurassic samples, may store gas as a solute. Different surface area:TOC ratios between D-M and Jurassic shales may be a result of thermal maturation. Jurassic strata have equivalent vitrinite reflectances (%Ro) typically <1.2%Ro (Ross and Bustin, in press) whilst D-M shales have vitrinite reflectance values ranging between 1.6 and 4.5%Ro (Morrow et al., 1993; Potter et al., 2000). At greater thermal maturity, diagenesis may structurally transform organic matter, creating more microporosity (Figure 5A; Laxminarayana and Crosdale, 1999).
A solute gas in Jurassic samples is also indicated by the linear correlation between pressure and sorption capacity (Figure 6). Sorption experiments of microporous materials result in Type I isotherms (Brunauer et al. 1940) due to gas saturation at higher pressures from the completion of a monolayer. Type I isotherms are not indicative for some Jurassic samples as the sorption process follows Henry's Law (Duffy et al, 1961): the concentration of gas in solution is directly proportional to the partial pressure of that gas above the solution.
The potential importance of clays to gas adsorption is shown in Figure 7. These isomaturity Devonian mudrocks have comparable TOC concentrations but significantly different clay contents and adsorption capacities - most notably at reservoir pressures (~30 MPa). Larger adsorption capacity of clay-rich samples (on a dry basis) reflects the microporosity of illite and kaolinite (Ross and Bustin, in prep). Importantly, it highlights inorganic factors which can influence the relationship between gas sorption and TOC.
The extent to which microporous materials can sorb methane is affected not only by the pore structure, but also by temperature (Yee et al., 1993). Temperature dependence of gas sorption is indicated by the reduction of sorbed gas capacities with increasing temperature (Figure 8). Temperature increase from 30-50°C lowers sorbed gas capacities by 45-80% where the percent reduction is partly dependent on the organic concentrations. D-M strata in northern BC are buried to more than 3 km depth and reservoir temperatures range between 120-155°C (geothermal gradient of 40°C/km). In most cases, adsorption capacities do not significantly change following Langmuir extrapolation to reservoir pressures (up to 35 MPa) (Figure 8A). With high reservoir temperatures and low levels of adsorption, the plateau of the isotherm occurs at relatively low pressures, often in the range of 10-15 MPa. Due to the exothermic nature of gas adsorption, free gas capacities will be more significant at higher reservoir temperatures.
Similar to tight gas sand reservoirs, a significant proportion of the total gas capacity in shale gas reservoirs is free gas, as suggested by gas contents above critical saturation (e.g. Kuuskraa et al., 1992; Montgomery et al., 2005, Bustin, 2006). Hence quantifying total porosity and understanding shale physical properties on pore-size distributions are important. For Jurassic and D-M shales, porosity varies as a function of lithology. Clay-rich D-M sediments have average porosities of 6.6% (Figure 9A), where a significant proportion of that porosity is attributable to the aluminosilicate fraction (Ross and Bustin, in press). Quartz and carbonate-rich mudrocks tend to be tight with low porosity (hence relatively lower potential free gas capacities; Figure 9B), in the range of 0.6-2.1%. Quartz-rich mudrocks display similar pore properties as chert (Figure 9C) – low total pore volumes and tight-rock characteristics (pore diamters in the 10,000nm + range (Figure 9C).
As suggested by tight pore-structure characteristics of silica-rich mudrocks (Figure 9B), gas flow will be largely dependent on fracture networks (either natural or induced). Similar compositional attributes have been discussed with respect to production of the lower Barnett Shale interval (Montgomery et al., 2005). Quartz-rich horizons are effective gas-producing facies due to the suitable rock mechanical properties of brittle rocks to fracture stimulation. Operators have found that clay shales (e,g, Upper Cretaceous in the WCSB, Caney Shale) do not respond as well to fracture stimulation as silica-rich shales (Figure 10A) (Brown, 2006).
Evaluating Silica Distribution: Excess SiO2 Concentrations Jurassic and D-M sediments are characterized by high Si/Al ratios. Excess silica contents, which are SiO2 levels above 'normal' detrital background, were calculated using the formula:
Elementxs = elementsample [(element/Al)background x Alsample]
A Si/Al ratio of 3.11 is used for AS (Wedepohl, 1971). Up to 91% of the SiO2 in Jurassic sediments and up to 70% SiO2 in D-M sediments cannot be accounted for by the aluminosilicate phase. Although a detrital source of the silica cannot be completely discounted (e.g., silt-sized quartz), excess Si is attributed to biogenic sources because: 1) TOC contents are high (up to 21 wt%) (Figure 10B) and; 2) Ti concentrations are close to ‘average shale’ values (Ross and Bustin, in press).
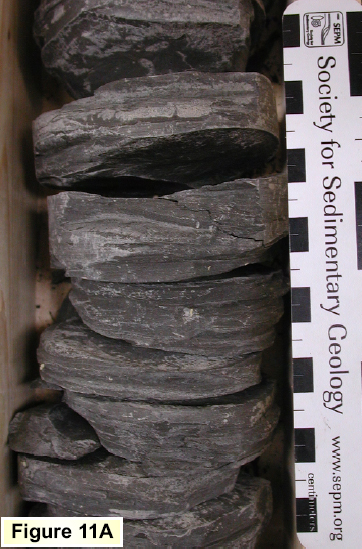
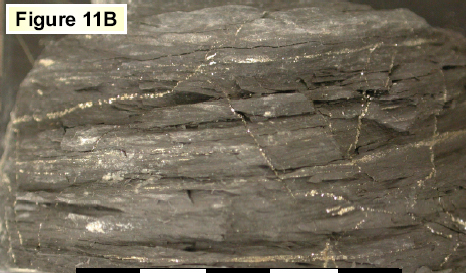
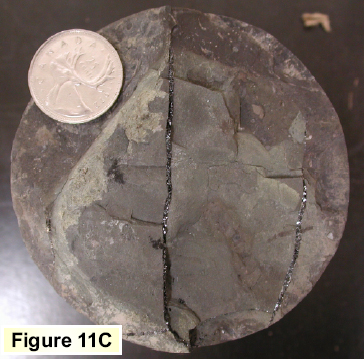
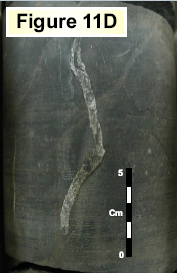
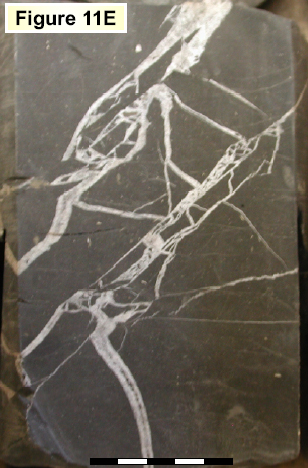
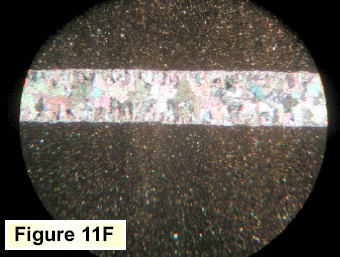
The effect of shale composition on fracture development can be seen at the macroscopic scale. Clay-rich shales show no natural fracturing (Figure 11A) and are friable. Silica-rich Jurassic and D-M shales have complex fracture networks which are often healed with pyrite (11B), bitumen (11C) or calcite (11D and 11E). Thin-section work also reveals micro-fractures with calcite cementation (11F).
Significance of Pore Structure for Resource Evaluation To predict gas contents and forecast production, models for analogous reservoirs are often used for comparative purposes (e.g. Barnett Shale). However due to complex reservoir phenomena, including pore structure heterogeneity, direct comparisons may produce erroneous results even at the laboratory scale. This would have massive implications on resource estimates.
The Bigger Picture: Regional Resource Assessment Both Jurassic and Devonian strata have excellent shale gas potential in northern BC. Resource estimates range between 1-32 Bcf/section for the Gordondale Member (Figure 13A) and over 240 Bcf/section fo the Besa River Fm (including the laterally equivalent Muskwa Fm; Figure 13B). For comparison, the areal extent of the Fort Worth Basin is also shown in Figure 13B, highlighting the significant resource potential of Devonian strata - all of which is beyond the oil window and into the dry-gas generation zone.
The data presented here accounts for only some of the physical properties of shale which need to be considered to accurately quantify shale gas resource potential. To apply reservoir models (e.g., storage capacity, production forecasting), an understanding sediment heterogeneity is needed. This is complex as not only are there significant geological differences between shale gas reservoirs, the reservoir components are interrelated (Figure 14) where a balance may need to be sought between favorable reservoir attributes (e.g., high fracture potential of low porosity, siliceous D-M mudrocks).
The results of this research highlight the difficulty to predict sorbed gas capacities of shales based on TOC contents and, to a certain extent, maturation levels. Shales contain a wide variety or organic and inorganic phases in a complex pore-structure network which varies from one shale formation to another, and within a formation itself. On the basis of our data-set, the ability to establish a model of shale gas reservoir capacity is complicated due to the nano-scale heterogeneity, hence the prediction of methane capacities is problematic. Producibility (permeability) is fundamental to economic gas production and further expansion of shale plays in the WCSB will require a better understanding of the causative factors of fracture formation, including the influence of lithology and the importance of pre-existing fractures.
Financial support was provided by NSERC grant (Dr R.M. Bustin), EnCana and CBM Solutions.
Brown, S., 2006, Shales require creative approaches: AAPG Explorer, November, p. 6, 8, 10. Brunauer, S. L.S. Deming, W.S. Deming, and E. Teller, 1940, On a theory of van der Walls adsorption of gases: The Journal of the Chemical Society, v. 62, p. 1723-1732. Burggraaf, A.J., 1999, Single gas permeation of thin zeolite (MFI) membranes: Theory and analysis of experimental observations: Journal of Membrane Science, v. 155, p. 45-65. Bustin, R.M., 2005, Gas shale tapped for big play: AAPG Explorer, February. Duffy, J.R., N.O. Smith, and B. Nagy, 1961, Solubility of natural gases in aqueous salt solutions: Liquidus surfaces in the system CH4-H20-NaCl2-CaLl2 at room temperatures and at pressures below 1000 psia: Geochimica et Cosmochimica Acta, v. 24, p. 23-31. Laxminarayana, C., and P.J. Crosdale, 1999, Role of coal type and rank on methane sorption characteristics of Bowen Basin, Australia Coals: International Journal of Coal Geology, v. 40, p. 309-325. Montgomery, S.L., D.M. Jarvie, K.A. Bowker, and R.M. Pollastro, 2005, Mississippian Barnett Shale, Fort Worth Basin, north-central Texas: Gas shale play with multi-trillion cubic foot potential: AAPG Bulletin, v. 89, p. 155-175. Morrow, D.W., J. Potter, B. Richards, and F. Goodarzi, 1993, Paleozoic burial and organic maturation in the Liard Basin Region, northern Canada: Bulletin of Canadian Petroleum Geology, v. 41, P. 1731. Potter, J., F. Goodarzi, D.W. Morrow, B.C. Richards, and L.R. Snowdon, 2000, Organic petrology, thermal maturity, and Rock-Eval/TOC data for Upper Paleozoic strata from selected wells between 60o and 61 oN and 122 oW and 123 o30’W, district of Mackenzie: Geological Survey of Canada Open File Report 3925. Ross, D.J.K., and R.M. Bustin, Shale gas potential of the Lower Jurassic Gordondale Member, northeastern British Columbian, Canada: Bulletin of Canadian Petroleum Geology, in press. Ross, D.J.K., and R.M. Bustin, Sediment geochemistry of the Lower Jurassic Gordondale Member, northeastern British Columbia: Bulletin of Canadian Petroleum Geology, in preparation. Teichmuller, M., 1986, Organic petrology of source rocks, history and state of the art: Organic Geochemistry, v. 10, p. 581-599. Yee, D., J.P. Seidle, and W.B. Hanson, 1993, Gas sorption on coal measurements and gas content, in B.E. Law and D.D. Rice, eds., Hydrocarbons from Coal: AAPG Studies in Geology no. 38, p. 203-218. |


