Click to view article in PDF format.
GCSeismic Imaging of Hidden Targets*
By
Bob Hardage1
Search and Discovery Article #40247 (2007)
Posted July 18, 2007
*Adapted from the Geophysical Corner column, prepared by the author, in AAPG Explorer, July, 2007, and entitled “How Can You See What’s Hidden?”. Editor of Geophysical Corner is Bob A. Hardage. Managing Editor of AAPG Explorer is Vern Stefanic; Larry Nation is Communications Director.
1Bureau of Economic Geology, The University of Texas at Austin ( [email protected])
Numerous oil and gas accumulations are beneath rock layers that effectively hide a reservoir by causing downgoing seismic raypaths to bend away from the geology that confines the hydrocarbons. How do we look into such hidden places?
There are two requirements for analyzing a “hidden” reservoir with seismic technology:
1) First, a seismic wavefield must illuminate the target.
2) Second, the wavefield that is backscattered from this illumination must be converted into an image.
Much seismic research has been done to develop algorithms that create images from backscattered wavefields. Our objective in this article is to focus on the issue that has been less emphasized, which is: “How do you illuminate a hidden target?".
uFigure captionsuThe problemuOne optionuRecommendation
uFigure captionsuThe problemuOne optionuRecommendation
uFigure captionsuThe problemuOne optionuRecommendation
uFigure captionsuThe problemuOne optionuRecommendation
|
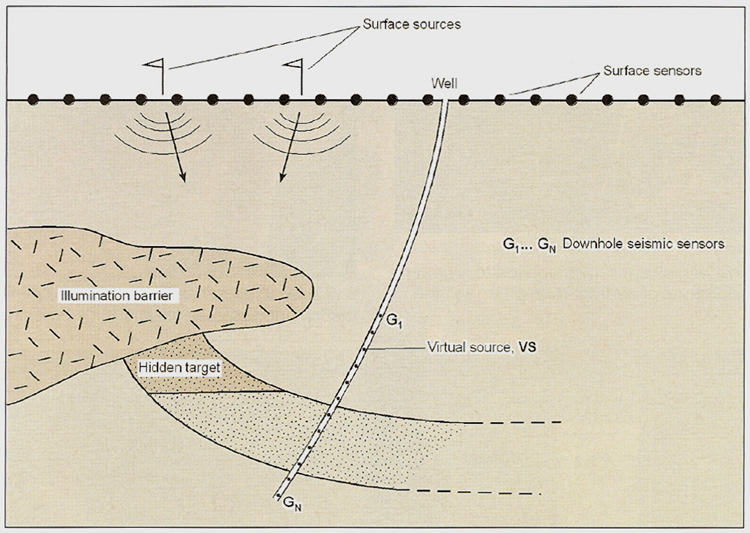
The ProblemWe will approach the problem from a simple point of view. Imagine that you are trying to find your car keys in a dark room with a hand-held spotlight. If you think the keys are underneath the chair, it may do no good to illuminate the chair with the spotlight pointed down from a high position. Instead, you have to lower the spotlight (the illuminating source) and your eyes (the backscatter receivers) so that the hidden area beneath the chair is first illuminated, and then is imaged.A geological equivalent to this “find the hidden keys” problem is illustrated in Figure 1, where a reservoir is hidden beneath a geological interval that does not allow it to be imaged with surface-positioned sources and receivers.
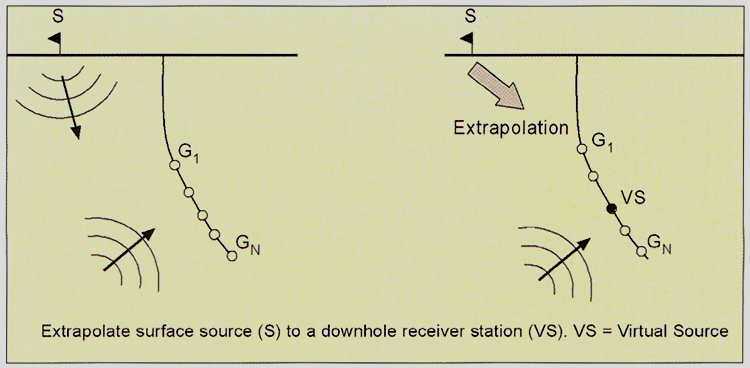
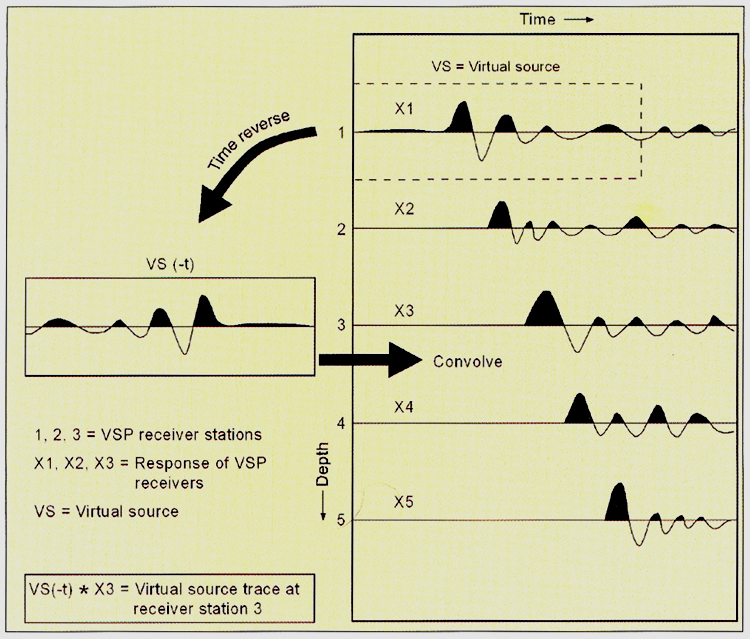
One OptionIf a well is near the hidden target, a method now being developed and applied by some companies involves the acquisition of vertical seismic profile (VSP) data with downhole receivers. Such a VSP data-acquisition concept is shown in Figure 1. For the geology illustrated here, surface-positioned sources and receivers cannot image the reservoir target. The VSP source-receiver geometry shown in Figure 1 helps in that the receivers are moved to deep positions where they can better image the hidden target; however, the sources are still on the Earth surface and are not illuminating beneath the geology that distorts the raypaths.Second OptionTo illuminate the reservoir, the source also has to be lowered – just as was the light source that was used to illuminate beneath the chair to find the car keys. This source repositioning is done mathematically, not by lowering a real source down a well (which is one option). The concept that is implemented is described in Figure 2. In the left diagram, we have a source-receiver geometry similar to the VSP geometry shown in Figure 1; in the right diagram, VSP surface-source (S) is repositioned to one of the downhole geophone stations by wavefield extrapolation. The lower position of this new virtual source (VS) now allows a different imaging strategy to be implemented. Although it requires numerous mathematical equations for most geophysicists to explain the procedure, the process of repositioning the source from the Earth surface to a deep borehole location can be illustrated with the graphic shown in Figure 3. In this figure, data traces X1 through X5 are the VSP data acquired with the surface-positioned source. In Figures 1 and 2, we positioned our virtual source at the third receiver station, but here we arbitrarily select VSP receiver Station 1 as the location for the downhole virtual source. The original VSP data are next converted to data that would be produced as if the source was at downhole Station 1 by:
1) Time reversing the data trace recorded at Station 1. 2) Convolving this time-reversed trace with all of the other data traces.
If you do not know what the mathematical process of “convolving” means, it is not important because your friends in the seismic data-processing community do. For this discussion, we will indicate convolution at receiver Station 3 by using an arrow to show the mathematical movement of time-reversed trace X1 across data trace X3. This mathematical process also is called cross-correlation, which may be a more familiar term. Once this cross-correlation is done at all receiver stations, we have created data that are equivalent to data acquired with a deep illuminating source at Station 1 and deep imaging sensors at all other stations. Initial results by those who practice this imaging technique confirm you can often see into places that are hidden from surface-based sources and receivers.
RecommendationShell has a powerful patent on this virtual-source concept that some companies are interested in licensing. No doubt intellectual property owned by others will come into play also. Some contractors are working to develop equivalents to what has been described here. My purpose is not to promote anyone’s business or intellectual property, but to alert you to an emerging and valuable seismic technology that will allow you, in some cases, to image geology that is difficult to see with other imaging strategies. Check with your favorite borehole seismic contractors about their ability to “look into hidden places” and inquire what they know about “virtual source” imaging and “seismic interferometry,” which are terminologies used by some when referring to this technique. |