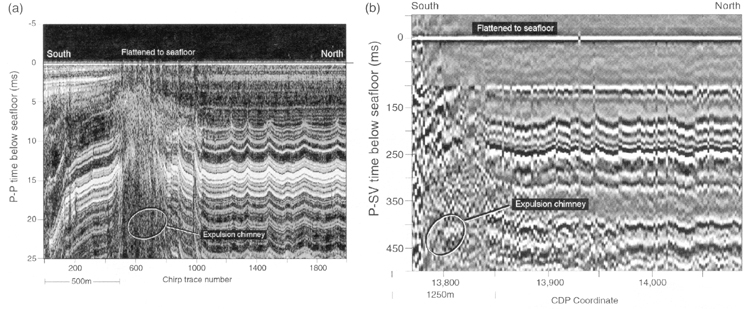
Figure 3. (a) High-frequency (2-10 kHz) AUV P-P image of near-seafloor strata across a fluid expulsion chimney. (b) Low-frequency (10-100 Hz) P-SV image along the same profile. Visual comparisons show the images have equivalent spatial resolutions and thus equivalent wavelength spectra. The south end of the P-SV profile starts at about AUV chirp-trace number 700. These images have been flattened to the seafloor, which causes small-throw faults (throws of one meter and less) to appear as chevron-shaped patterns.