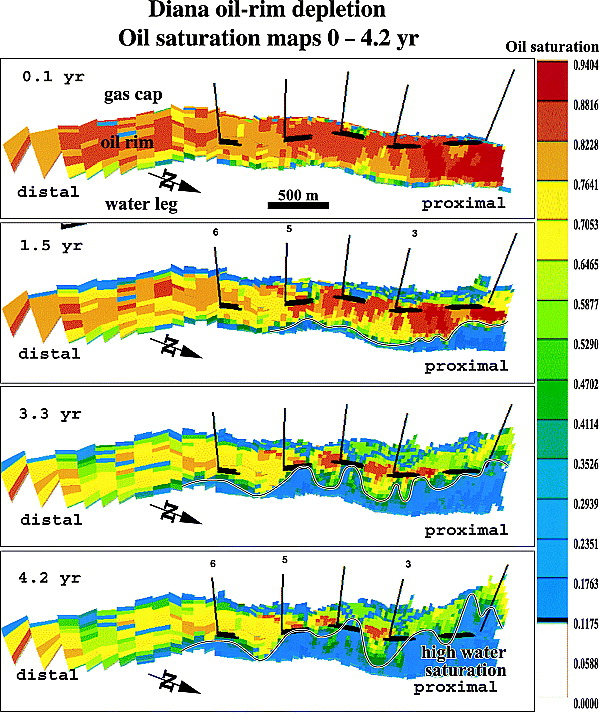
FIGURE 20. Oil saturation maps for the Diana oil rim for the first 4 yr of production. Note that the Diana gas cap and aquifer are not shown. The updip portion of the reservoir has higher initial oil saturations because of its higher porosities and also starts making high water cuts earlier than the downdip portion of the reservoir because of its more amalgamated character and better reservoir quality. The smaller cell size observed at the proximal portion of the model reflects the downscaling of the reservoir relative to the distal portion of the reservoir that was upscaled (modified from Sullivan et al., 2000a).