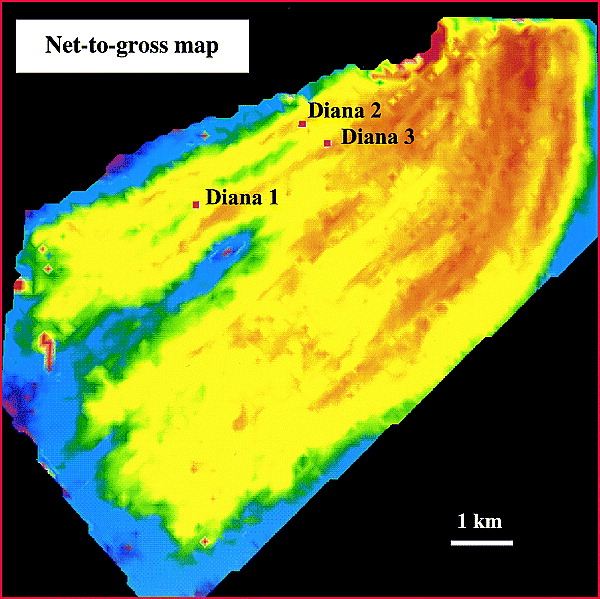
FIGURE 18. Net-to-gross
map generated from the facies model, assuming a constant net-to-gross of 0.95,
0.85, 0.65, and 0.10 for the channel axis, channel off-axis, channel margin
facies, and overbank facies, respectively. Net-to-gross ranges from greater than
0.95 in the proximal area (red) to less than 0.40 in the distal area (purple). A
low net-to-gross
crease,
shown just east of the southern stewardship polygons, honors an interpreted
net-to-gross low, visible on seismic amplitude maps.