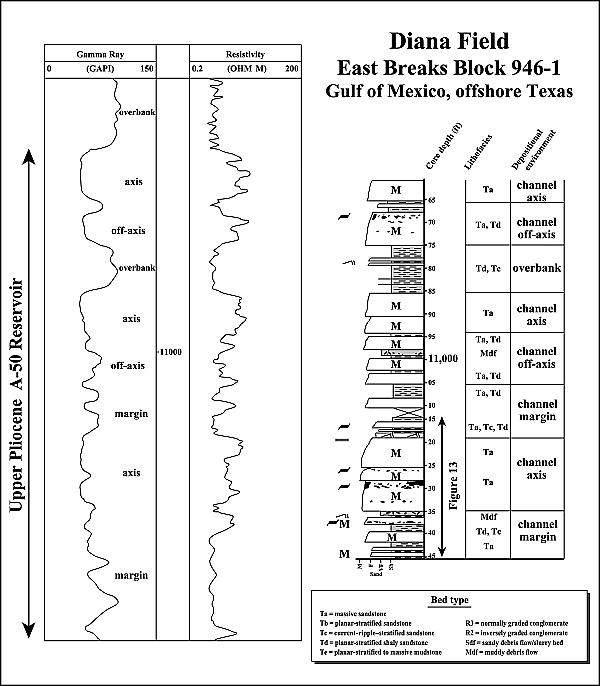
FIGURE 14. Summary plot for EB 946-1 well (Diana 3) illustrating core lithofacies, interpreted depositional setting, and relationship between log and core depths for the A-50 reservoir. A statistical foot-by-foot comparison of gamma-ray logs vs. core-described facies for all cored intervals was used to interpret the depositional facies in uncored portions of wells. These facies-blocked wells were then used to condition the object-based model and control channel distribution and vertical stacking patterns (modified from Sullivan and Templet, 2002).