Click on image for enlargement.
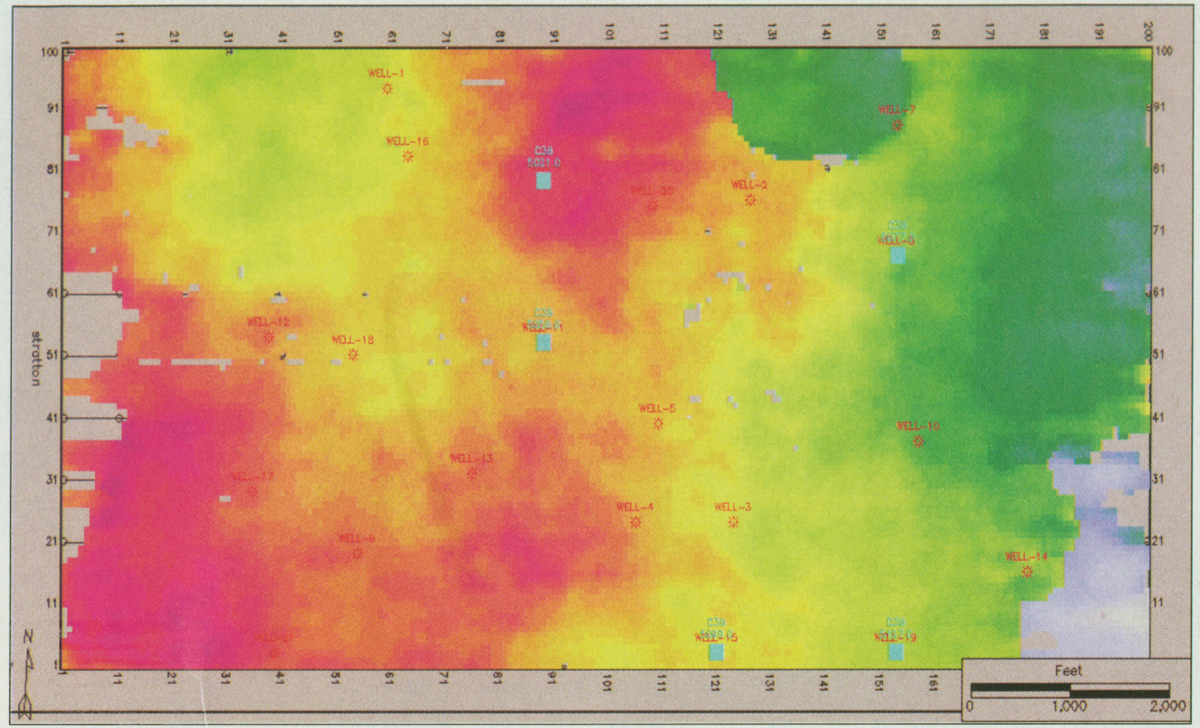
Figure 6. Structure map from automatic tracking of the positive-to-negative zero crossing on the cosine-of-phase data.
Click on image for enlargement.
Figure 6. Structure map from automatic tracking of the positive-to-negative zero crossing on the cosine-of-phase data.