Click on image for enlargement.
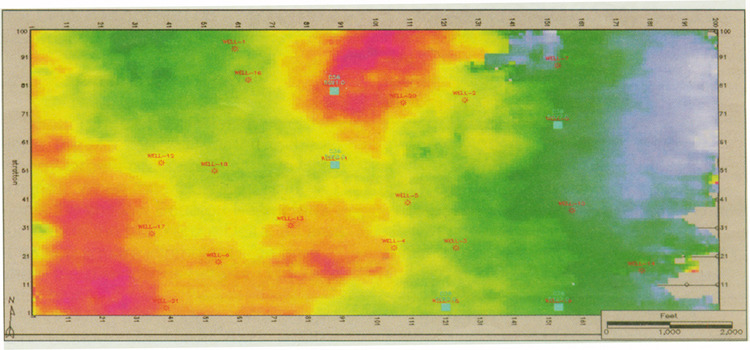
Figure 4. Structure map from automatic tracking of the peak on cosine-of-phase data. Compare with Figure 2. Errors and omissions are different.
Click on image for enlargement.
Figure 4. Structure map from automatic tracking of the peak on cosine-of-phase data. Compare with Figure 2. Errors and omissions are different.