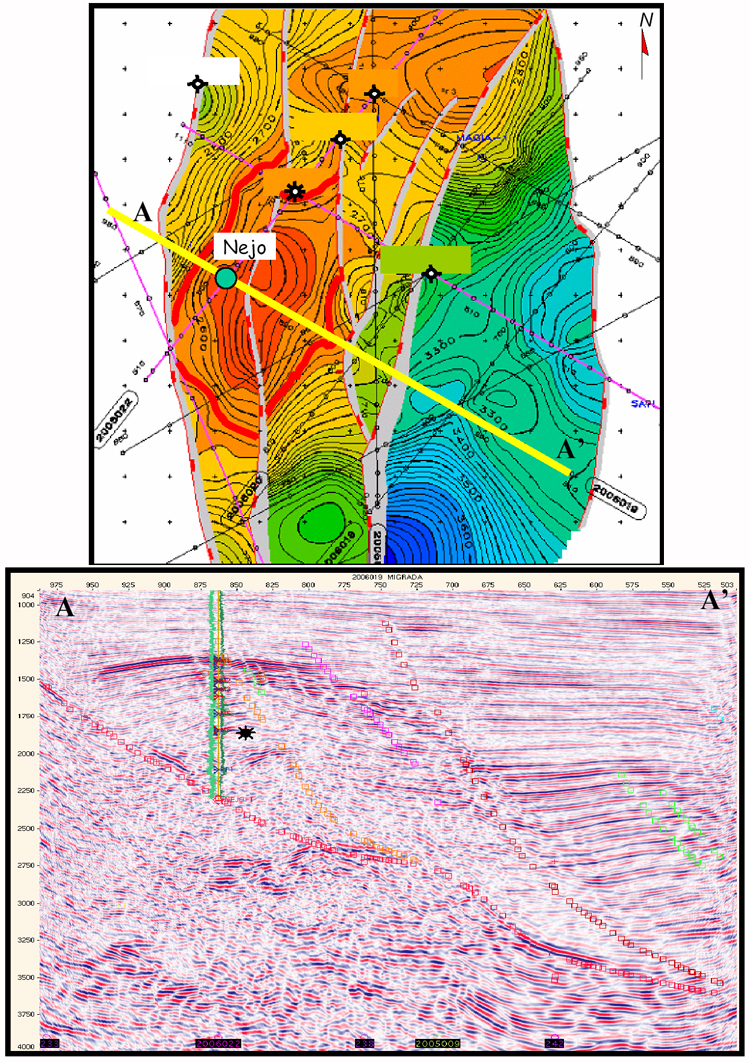
Figure 3a. Structural seismic map at the top of the Frio Marino Formation. Red areas represent the highest part of the rollover anticlinal structure. Note the N-S strike direction of the faults. The yellow line A-A’ is the location of the seismic profile in Figure 3b.
Figure 3b. Depth migrated seismic cross section, with Nejo well. Normal listric faulting is interpreted, with faults shown by strings of squares outlined in color. The prospect is formed by a rollover anticline. Line in Figure 3a.