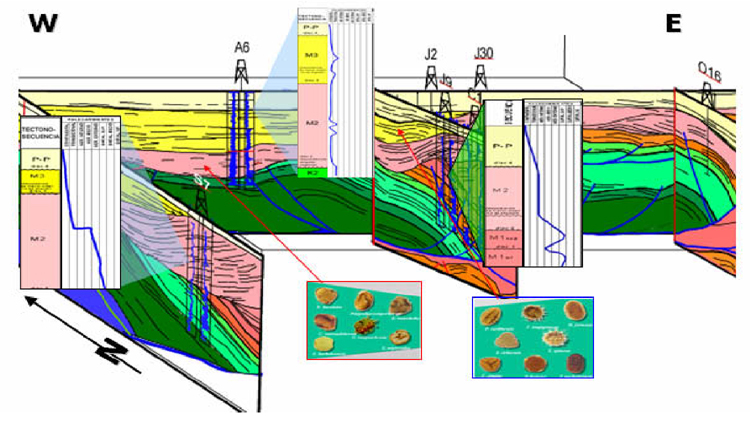
Figure 9. Spatial correlation of the stratigraphic sequences, the structural model, and the biostratigraphic data, based on a strike section (Figure 5). The integration of the paleo-environmental curves was obtained through the compendium of the biostratigraphic data available for the respective wells. Note that the sequence M2 shows dramatic changes in paleo-environments from South to North and also from West to East.