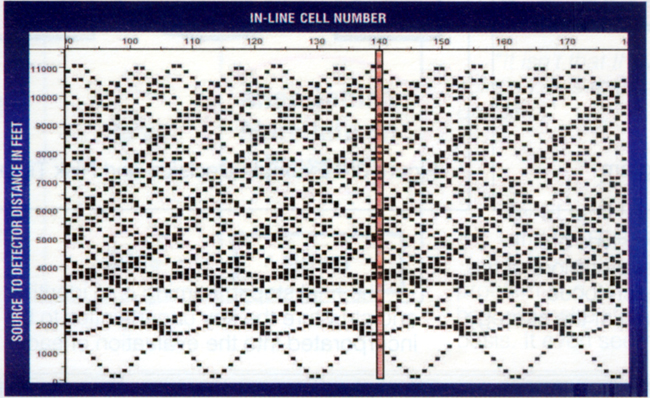
Figure 4A. "Necklace" plot for Narrow-Azimuth Design A. For these displays the Y (vertical) axis indicates source-to-detector offset distance in feet for each pre-stack trace within a cell. The X (horizontal) axis shows subsurface cell location. In-line cell number 140 has been highlighted to show all trace offset distances for a single cell. The offset distribution for this design is fairly uniform with 30 individual offset traces between 0 and 11,000 feet at cell number 140, for example. This should produce better results during data processing.