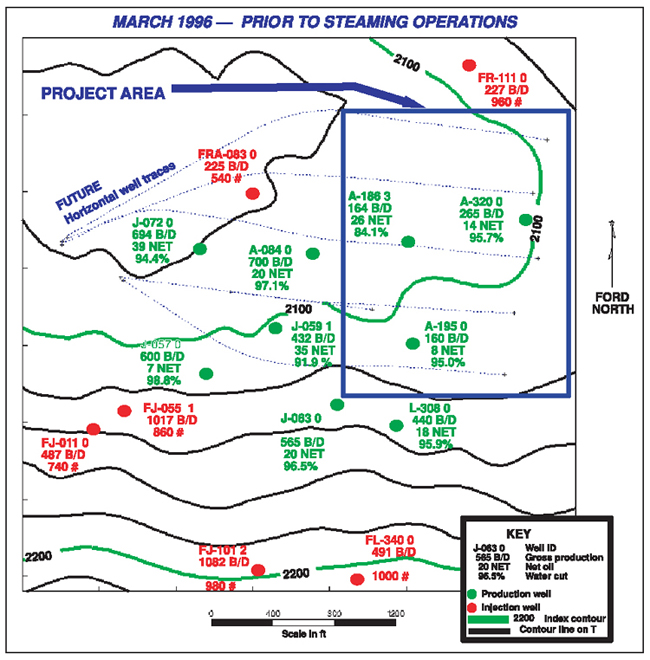
Figure 16. Fault Block V Tar zone waterflood configuration. Production and cut data are shown prior to steaming operations. Each production well is labeled in green with the name, gross production, net oil production, and water cut. The injection wells are labeled in red with well name, injection rate in barrels per day, and surface pressure. Structural contours are vertical subsea on the S sandstone with a 20-ft contour interval. Ford north refers to a local Cartesian coordinate system.
Click here to view the changes in production and cut data given in Figures 16, 17, and 18.