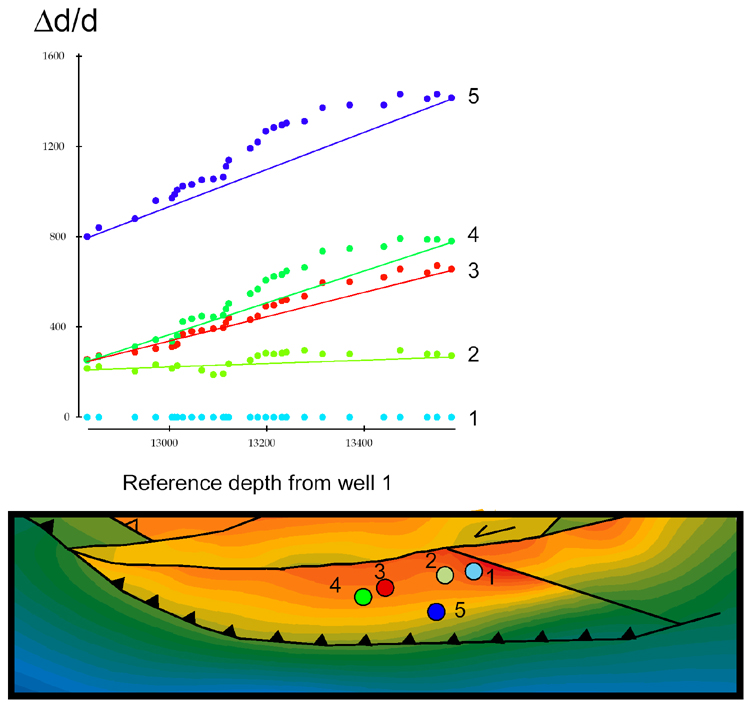
Figure 7.1. Stacked Bischke Plot, showing the differences of TVDs of several markers in five wells. Location of wells shown in map of structure on top Naricual Formation (Oligocene), Santa Barbara Field, Venezuela.
Figure 7.1. Stacked Bischke Plot, showing the differences of TVDs of several markers in five wells. Location of wells shown in map of structure on top Naricual Formation (Oligocene), Santa Barbara Field, Venezuela.