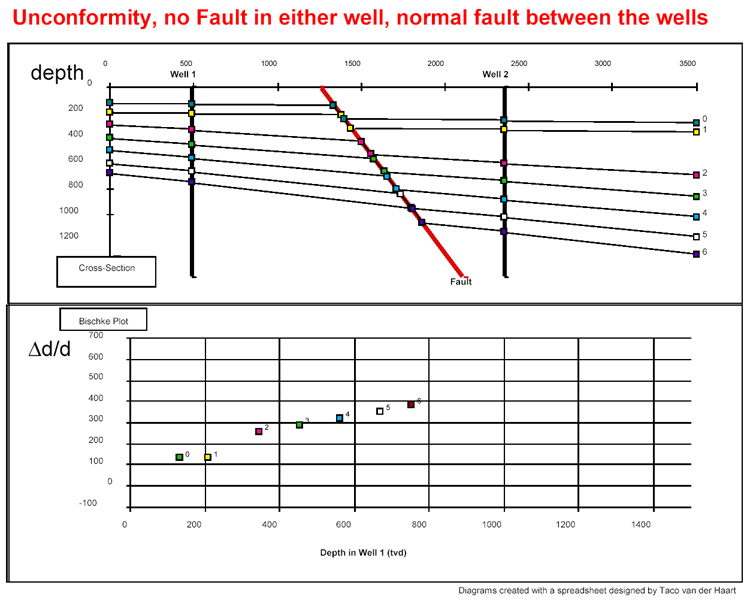
Figure 2.2. Bischke Plot and cross-section. The plot shows a change in slope related to the existence of an unconformity. The fault has no influence on the plot.
Figure 2.2. Bischke Plot and cross-section. The plot shows a change in slope related to the existence of an unconformity. The fault has no influence on the plot.