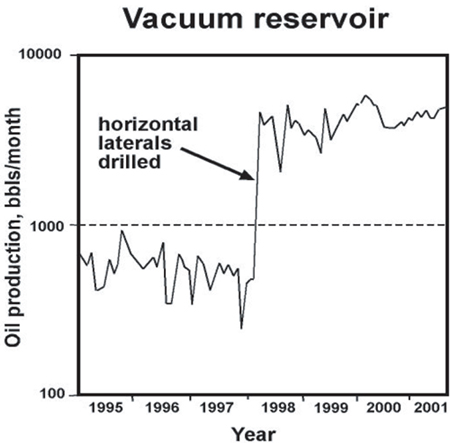
Figure 3.5. Plot of monthly oil production for period that included the introduction of horizontal laterals (after Pranter et al., 2004).
Figure 3.5. Plot of monthly oil production for period that included the introduction of horizontal laterals (after Pranter et al., 2004).