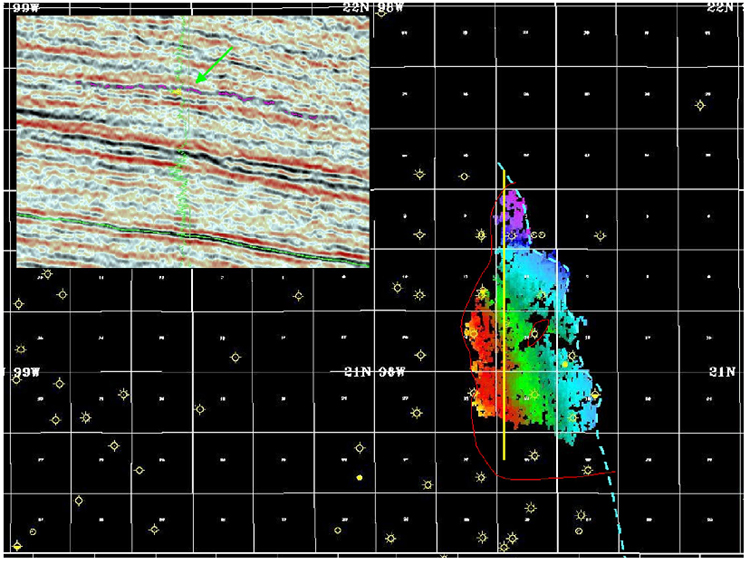
Figure 8: Structure map of anomaly with Desert Springs wells shown. The insert shows the pay sand on an SP curve overlain on the seismic. Although the field is larger than the mapped anomaly, current mapping is sufficient for exploration purposes. The downdip edge of the anomaly shows the gas-water contact (dashed, blue line), and the updip edge is coincident with the 40-ft gross sand isopach (red line). The divergence from the 40-ft contour on the southern end is likely due to a facies change in the reservoir. Field development would require more detailed mapping and advanced seismic techniques.
Click on inset for enlargement of it.